Difference between revisions of "Assignment 7 - 2013"
Jump to navigation
Jump to search
Kevin Dunn (talk | contribs) (Created page with "{{OtherSidebar | due_dates = 15 November 2013, at class | dates_alt_text = Due date(s) | questions_PDF = 4N4-2013-Assignment-7.pdf | questions_link = | questions_text_alt = As...") |
Kevin Dunn (talk | contribs) |
||
| Line 10: | Line 10: | ||
| other_instructions = ''Tutorial date: 11 November 2013'' | | other_instructions = ''Tutorial date: 11 November 2013'' | ||
}} | }} | ||
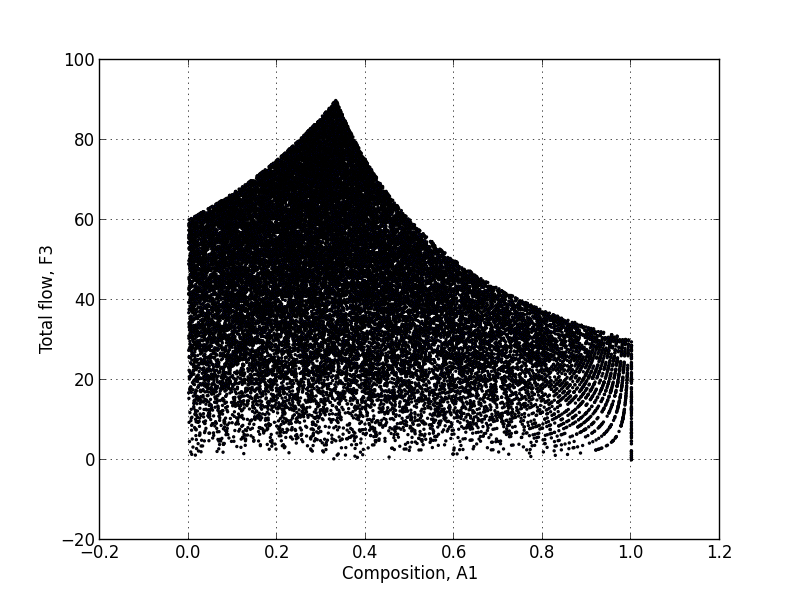
A brute force approach to get the operating window for a very simple system: | |||
[[Image:operating-window-assignment-7-4N4-2013.png]] | |||
<syntaxhighlight lang="python"> | |||
import numpy as np | |||
from matplotlib import pyplot | |||
N=100 | |||
for Fs in np.arange(0, 60.00001,0.2): # The process can operate between 0 and 100% open for Fs | |||
print(Fs) | |||
for Fa in np.random.uniform(0,30.00001,N): # The process can operate between 0 and 100% open for Fa | |||
flow = Fa + Fs | |||
composition = Fa/(flow + 1E-9) | |||
pyplot.scatter(composition, flow, s=2) | |||
# then plot the data as a dot; every dot represents a valid operating point | |||
pyplot.grid() | |||
pyplot.xlabel('Composition, A1') | |||
pyplot.ylabel('Total flow, F3') | |||
pyplot.savefig('operating-window-assignment-7-4N4-2013.png') | |||
pyplot.show() | |||
</syntaxhighlight> | |||
Revision as of 00:50, 19 November 2013
| Due date(s): | 15 November 2013, at class |
| Assignment questions | |
| Other instructions | Tutorial date: 11 November 2013 |
A brute force approach to get the operating window for a very simple system:

import numpy as np
from matplotlib import pyplot

N=100
for Fs in np.arange(0, 60.00001,0.2):			# The process can operate between 0 and 100% open for Fs
	print(Fs)
	for Fa in np.random.uniform(0,30.00001,N):	# The process can operate between 0 and 100% open for Fa
		flow = Fa + Fs
		composition = Fa/(flow + 1E-9)
		pyplot.scatter(composition, flow, s=2)

# then plot the data as a dot; every dot represents a valid operating point
pyplot.grid()
pyplot.xlabel('Composition, A1')
pyplot.ylabel('Total flow, F3')
pyplot.savefig('operating-window-assignment-7-4N4-2013.png')
pyplot.show()