Difference between revisions of "Software tutorial/Basic plots in R"
Kevin Dunn (talk | contribs) |
Kevin Dunn (talk | contribs) |
||
| Line 42: | Line 42: | ||
and ``type="o"`` will connect (overplot) the lines and points. | and ``type="o"`` will connect (overplot) the lines and points. | ||
Box plots | Box plots | ||
| Line 58: | Line 57: | ||
boxplot(website$Visits ~ website$DayOfWeek) | boxplot(website$Visits ~ website$DayOfWeek) | ||
</rst> | </rst> | ||
[[Image:website-traffic-boxplot-default.jpg|500px|center]] | [[Image:website-traffic-boxplot-default.jpg|500px|center]] | ||
Revision as of 15:29, 16 January 2014
<rst>
<rst-options: 'toc' = False/>
<rst-options: 'reset-figures' = False/>
A simple sequence plot
We will continue on with the data set described in the previous section. Load the dataset and let's plot the column called ``Visits`` - there are 4 columns in the dataset, so we must be specific on which one to plot.
.. code-block:: s
website <- read.csv('http://datasets.connectmv.com/file/website-traffic.csv') plot(website$Visits) Which produces this figure. Note that the defaults in R are to leave a lot of white space around the figure. We will show later how to remove that. </rst> [[Image: website-traffic-base.jpg|500px|center]] <rst> <rst-options: 'toc' = False/> <rst-options: 'reset-figures' = False/> That plot shows only the points (markers), in the order of the data set. What if you want lines between the points? Type ``help(plot)`` to find out more about the ``plot`` command. For example, it tells you there that ``type="p"`` will just show the points (the default setting for ``plot``): .. code-block:: s plot(website$Visits, type="p")
If you use ``type="l"`` you get a line plot:
.. code-block:: s
plot(website$Visits, type="l") and ``type="b"`` will show both lines and points, leaving a space between the point and the line connections .. code-block:: s plot(website$Visits, type="b")
and ``type="o"`` will connect (overplot) the lines and points.
Box plots
The basic boxplot syntax is:
.. code-block:: s
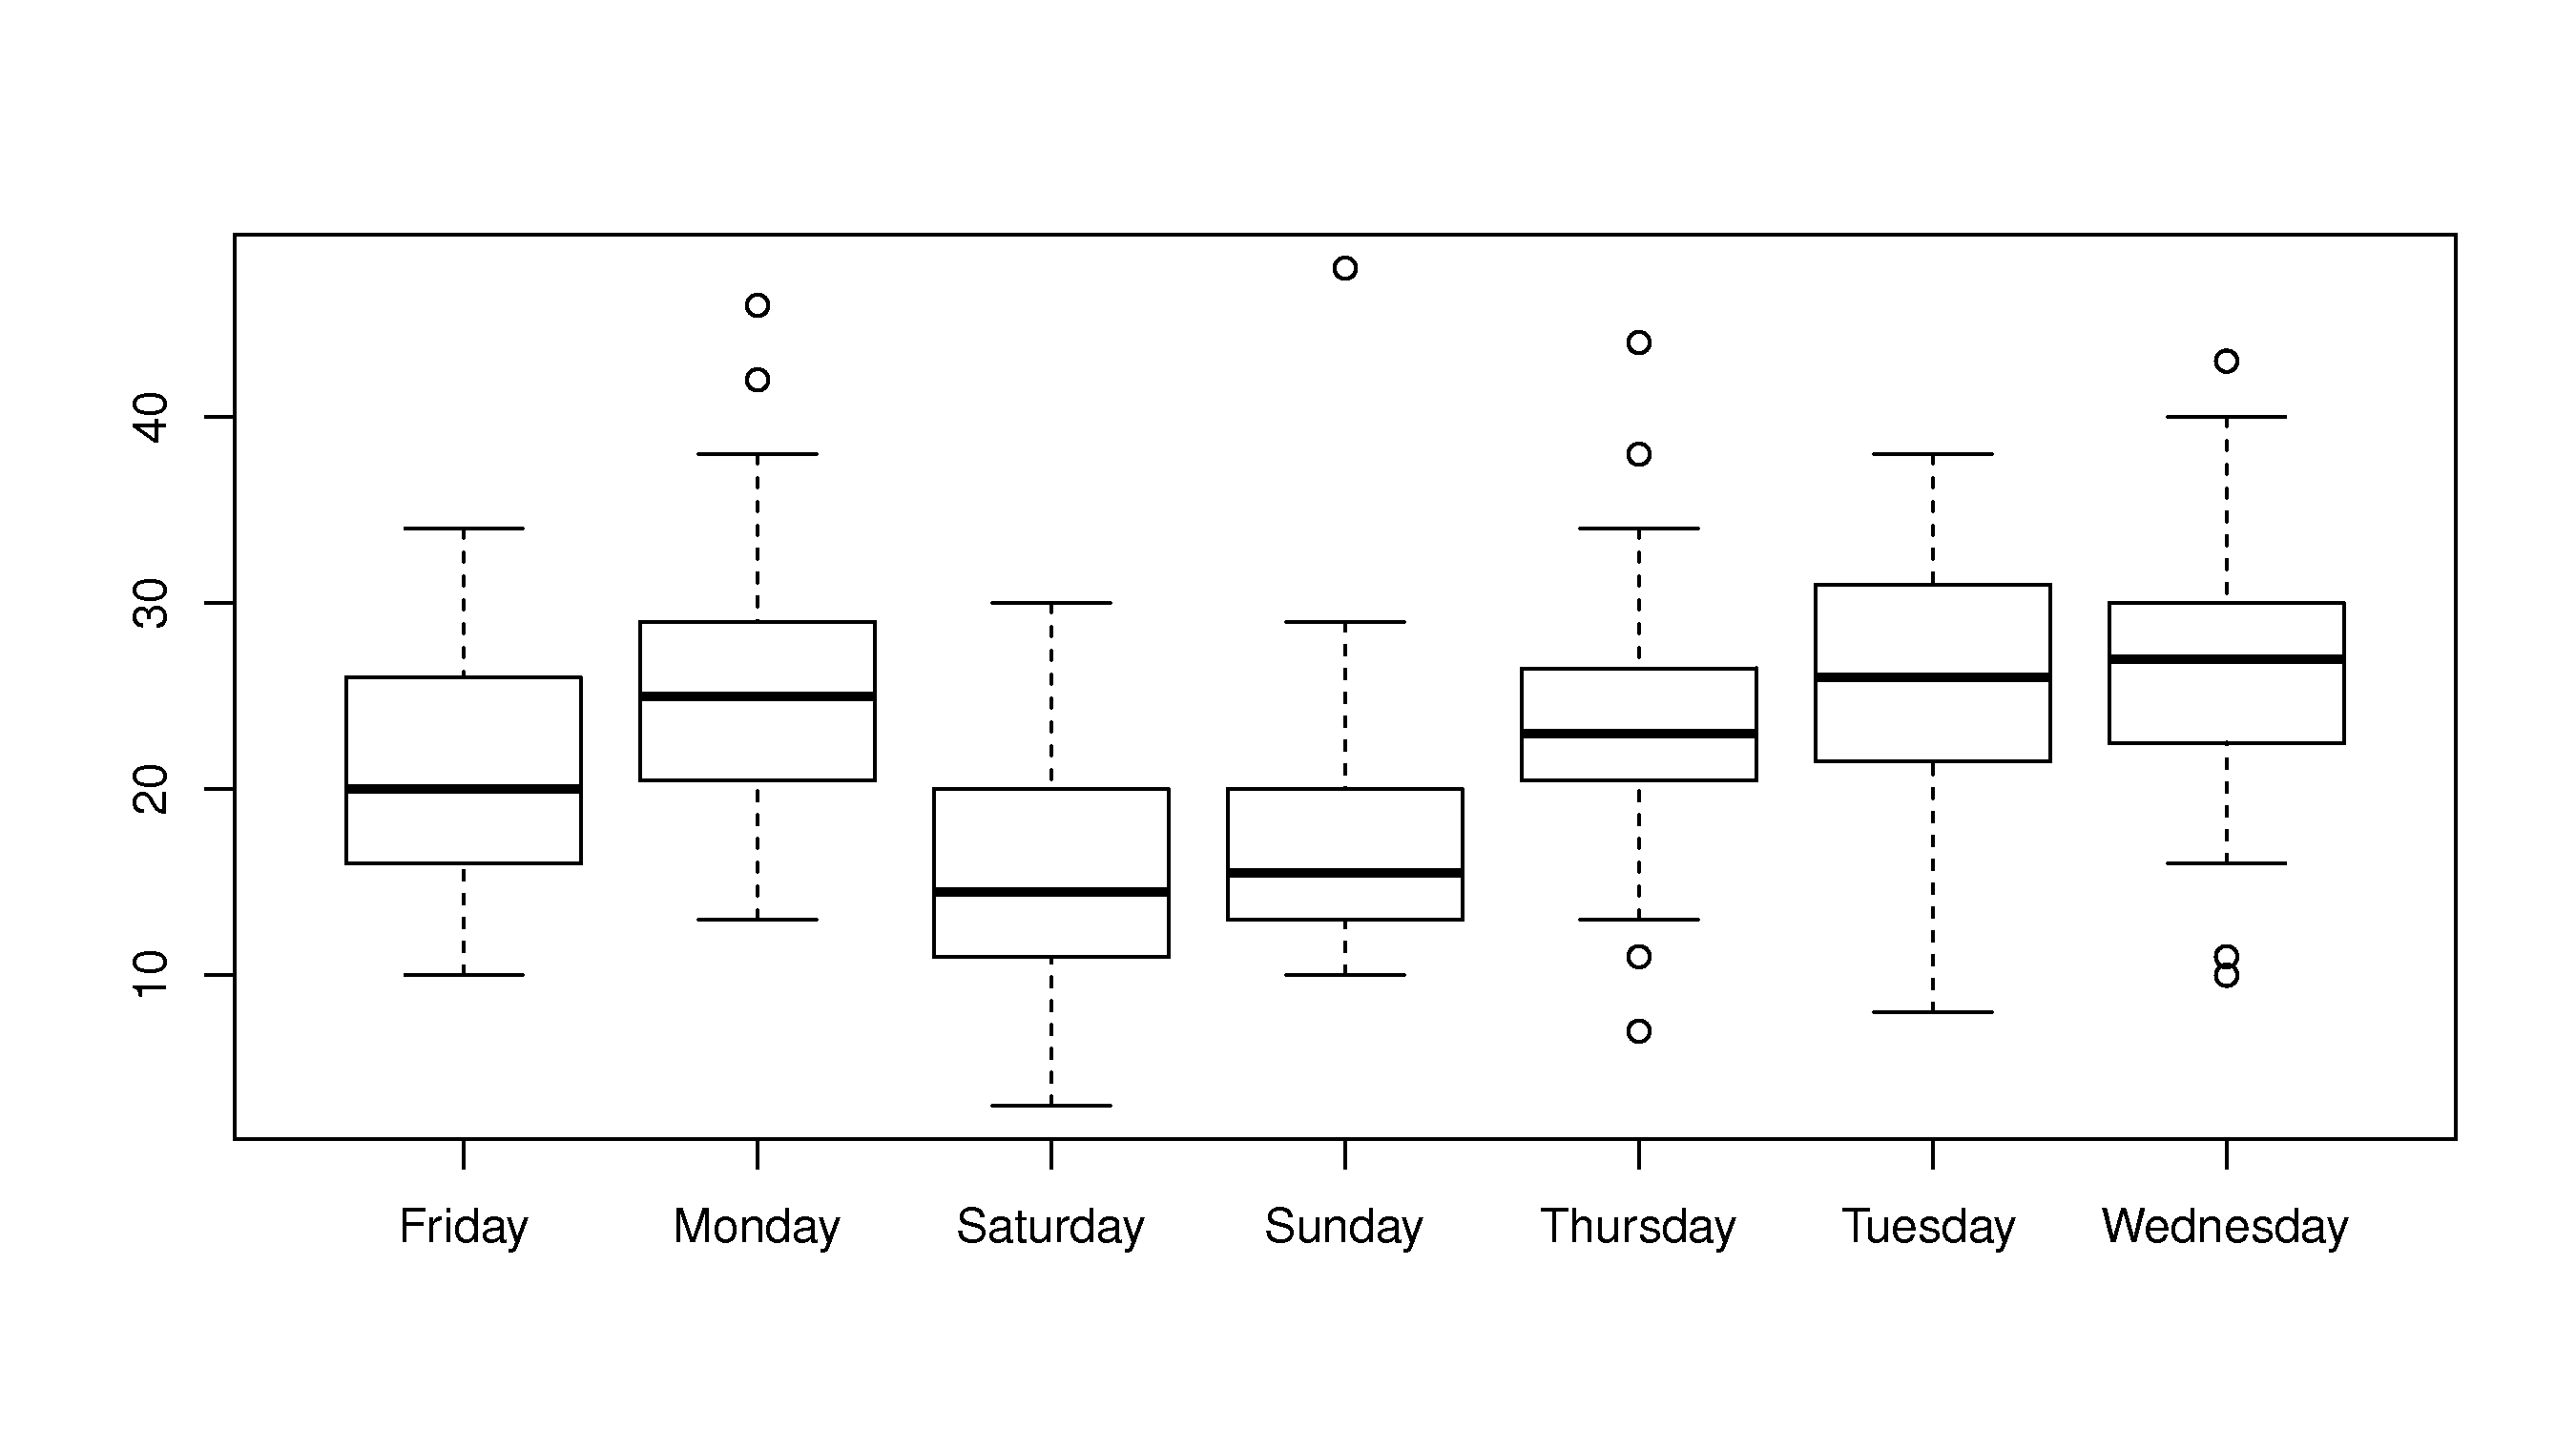
boxplot(website$Visits) To get boxplots for each day of the week, side-by-side we rely on the fact the column, ``DayOfWeek``, is a categorical variable. R calls these ``factor`` variables, and you can confirm this: ``is.factor(website$DayOfWeek)`` returns ``TRUE``. We can then tell the ``boxplot`` command to group the boxplots by a factor variable. Read the help text, ``help(boxplot)``, and ``help(factor)`` in order to understand more clearly how this plot was generated.
.. code-block:: s
boxplot(website$Visits ~ website$DayOfWeek)
</rst>
