Software tutorial/Dealing with factors (categorical variables)
<rst> <rst-options: 'toc' = False/> <rst-options: 'reset-figures' = False/> This section shows a bit about R's ability to deal with factors. Factors are variables that are coded for categories: e.g. ``male`` and ``female``, or another example could be day of the week: ``Monday, Tuesday, ..., Sunday``.
When you loaded the website data, not all of the raw data (take a look inside the CSV file) is numeric. The ``DayOfWeek`` is text, so R assumes this is a factor. It automatically goes and finds all unique values in that column (the names of the 7 days in the week in this case), and codes that as factor variable. But it sorts them alphabetically, ``Friday, Monday, ..., Wednesday``. If you want them in a different order, use the ``levels`` input option to tell R your preferred order:
.. code-block:: s
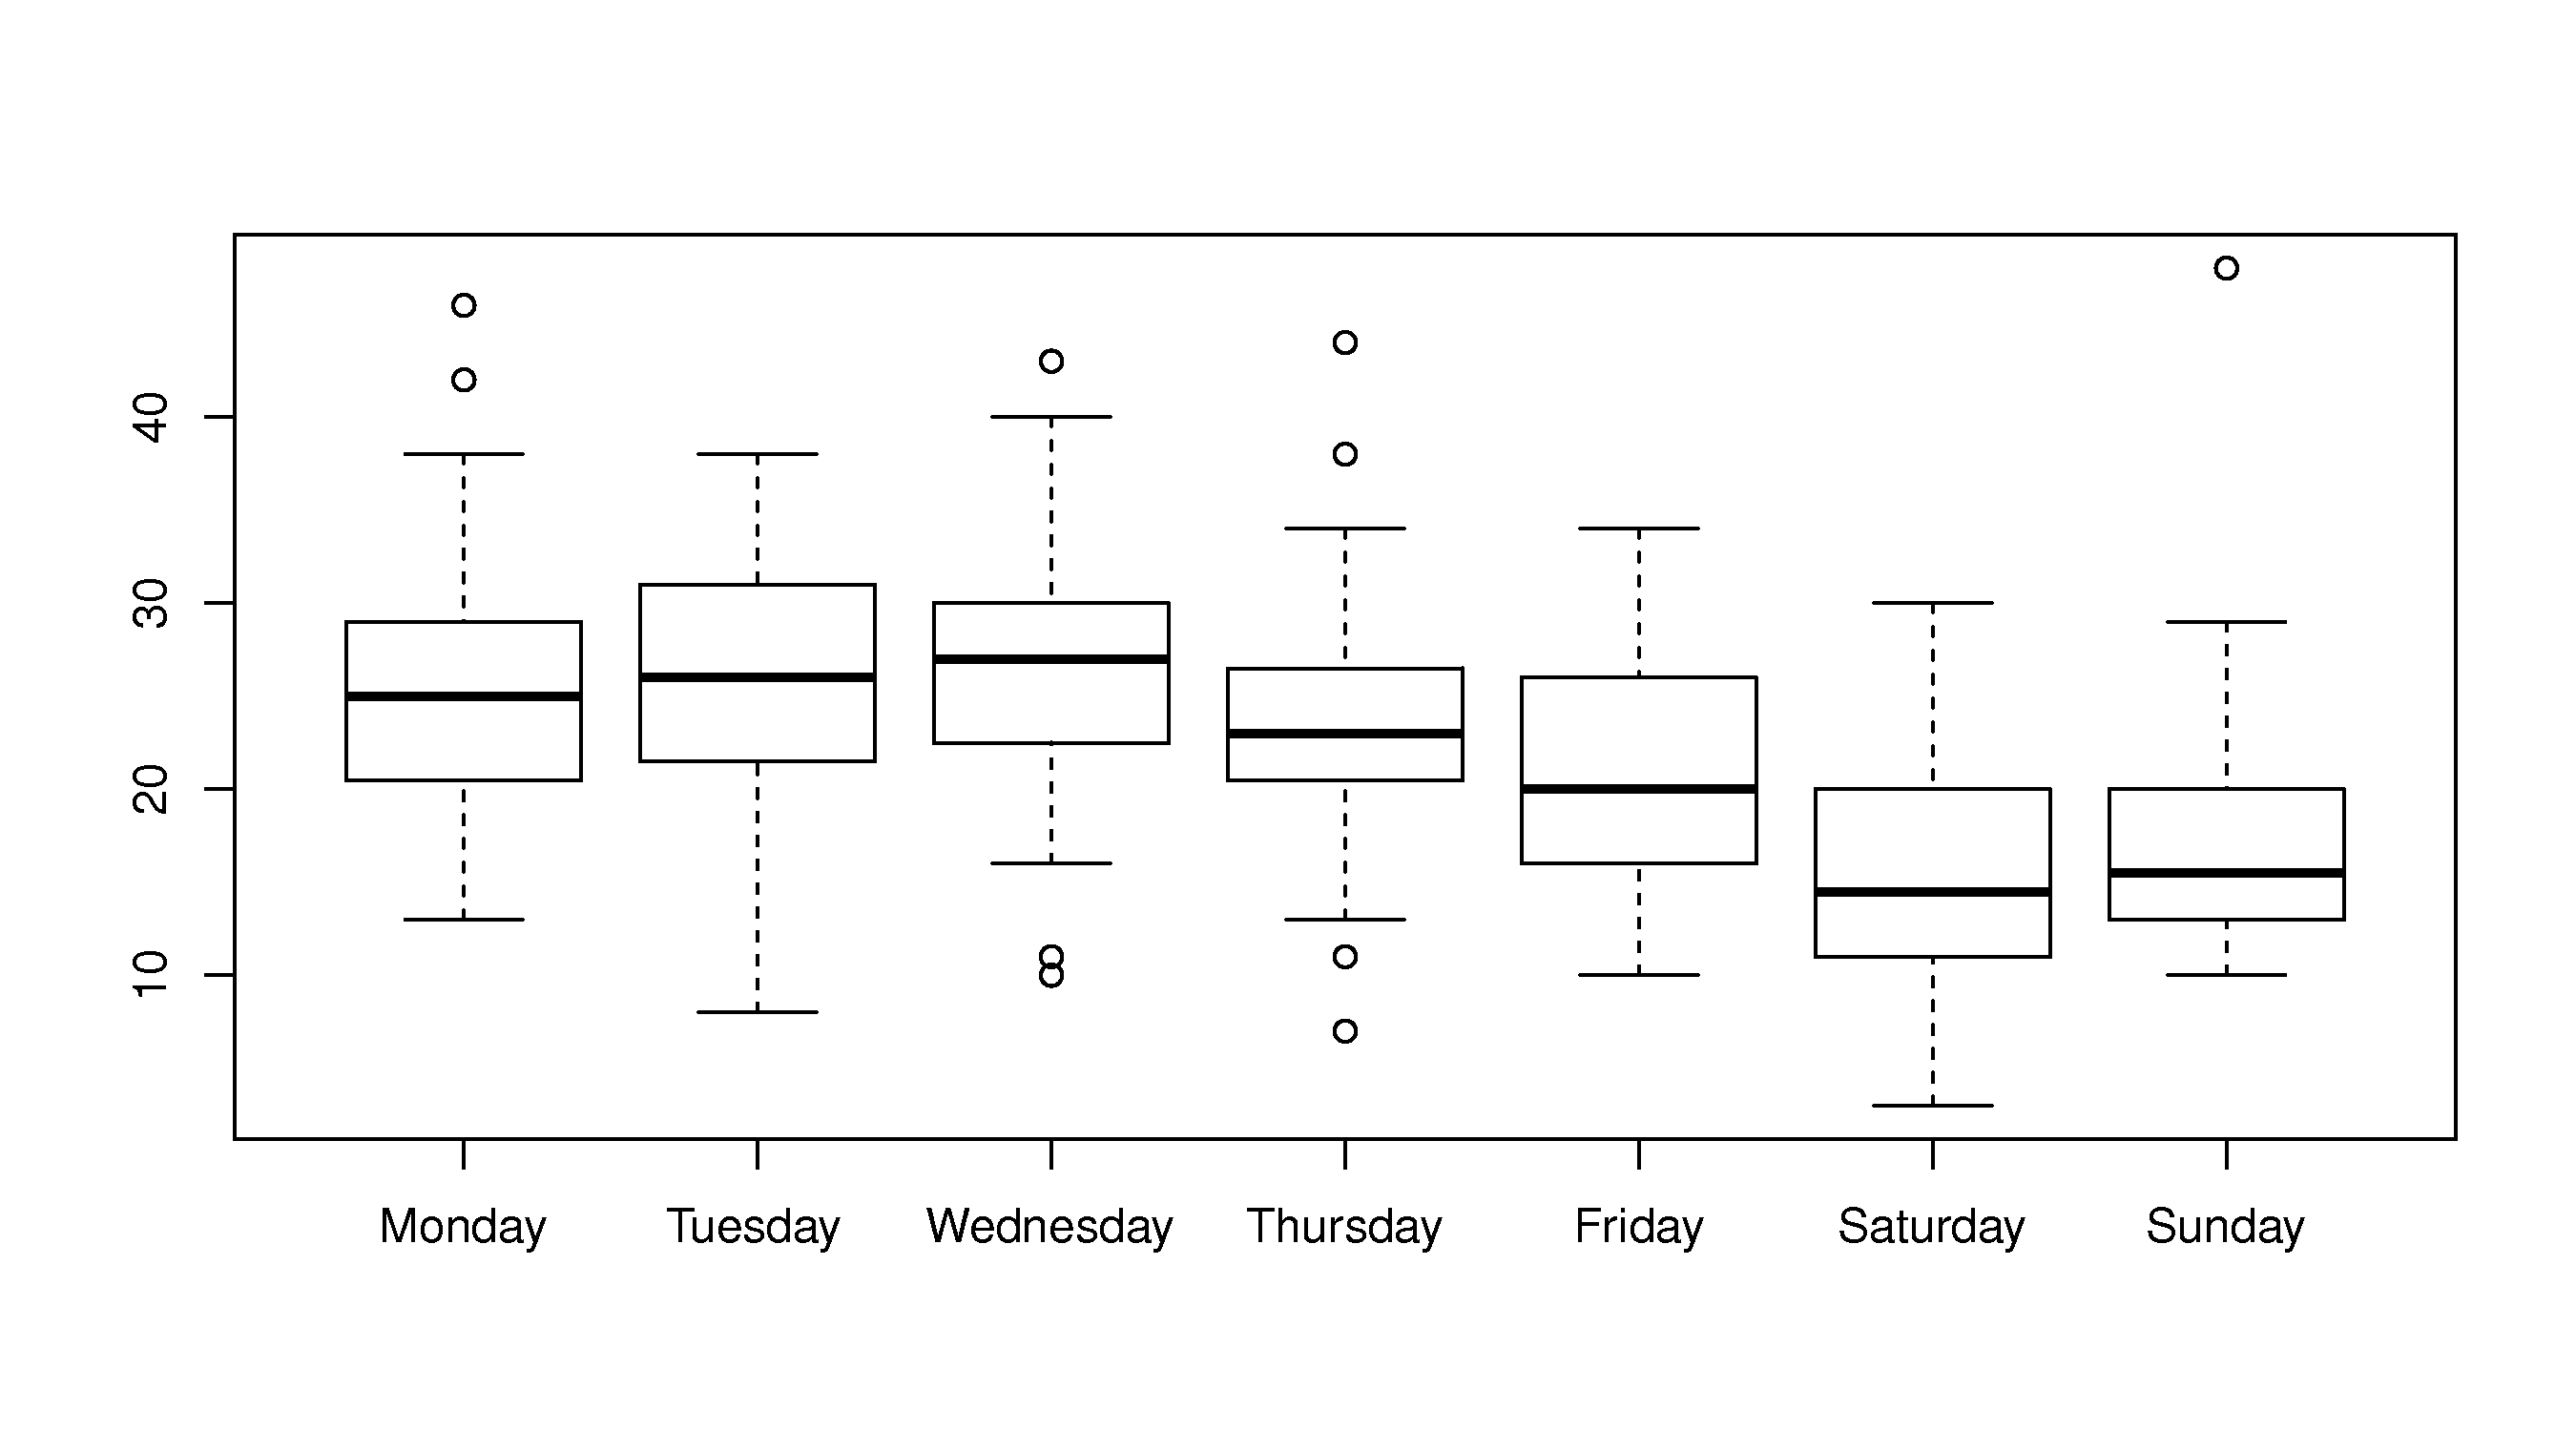
day.names <- c("Monday", "Tuesday", "Wednesday", "Thursday", "Friday", "Saturday", "Sunday" ) days <- factor(website$DayOfWeek, level=day.names) boxplot(website$Visits ~ days)
Now that boxplot will be ordered in a more useful way to see the weekly trends. The ``c()`` command creates a combination of items and the ``factor()`` command creates a factor variable. </rst>
