Software tutorial/Extending R with packages
<rst> <rst-options: 'toc' = False/> <rst-options: 'reset-figures' = False/> The basic R installation is pretty comprehensive. One of the advantages of R though is that it is constantly being updated with new packages. A package is collection of functions and other information that expand R's capabilities.
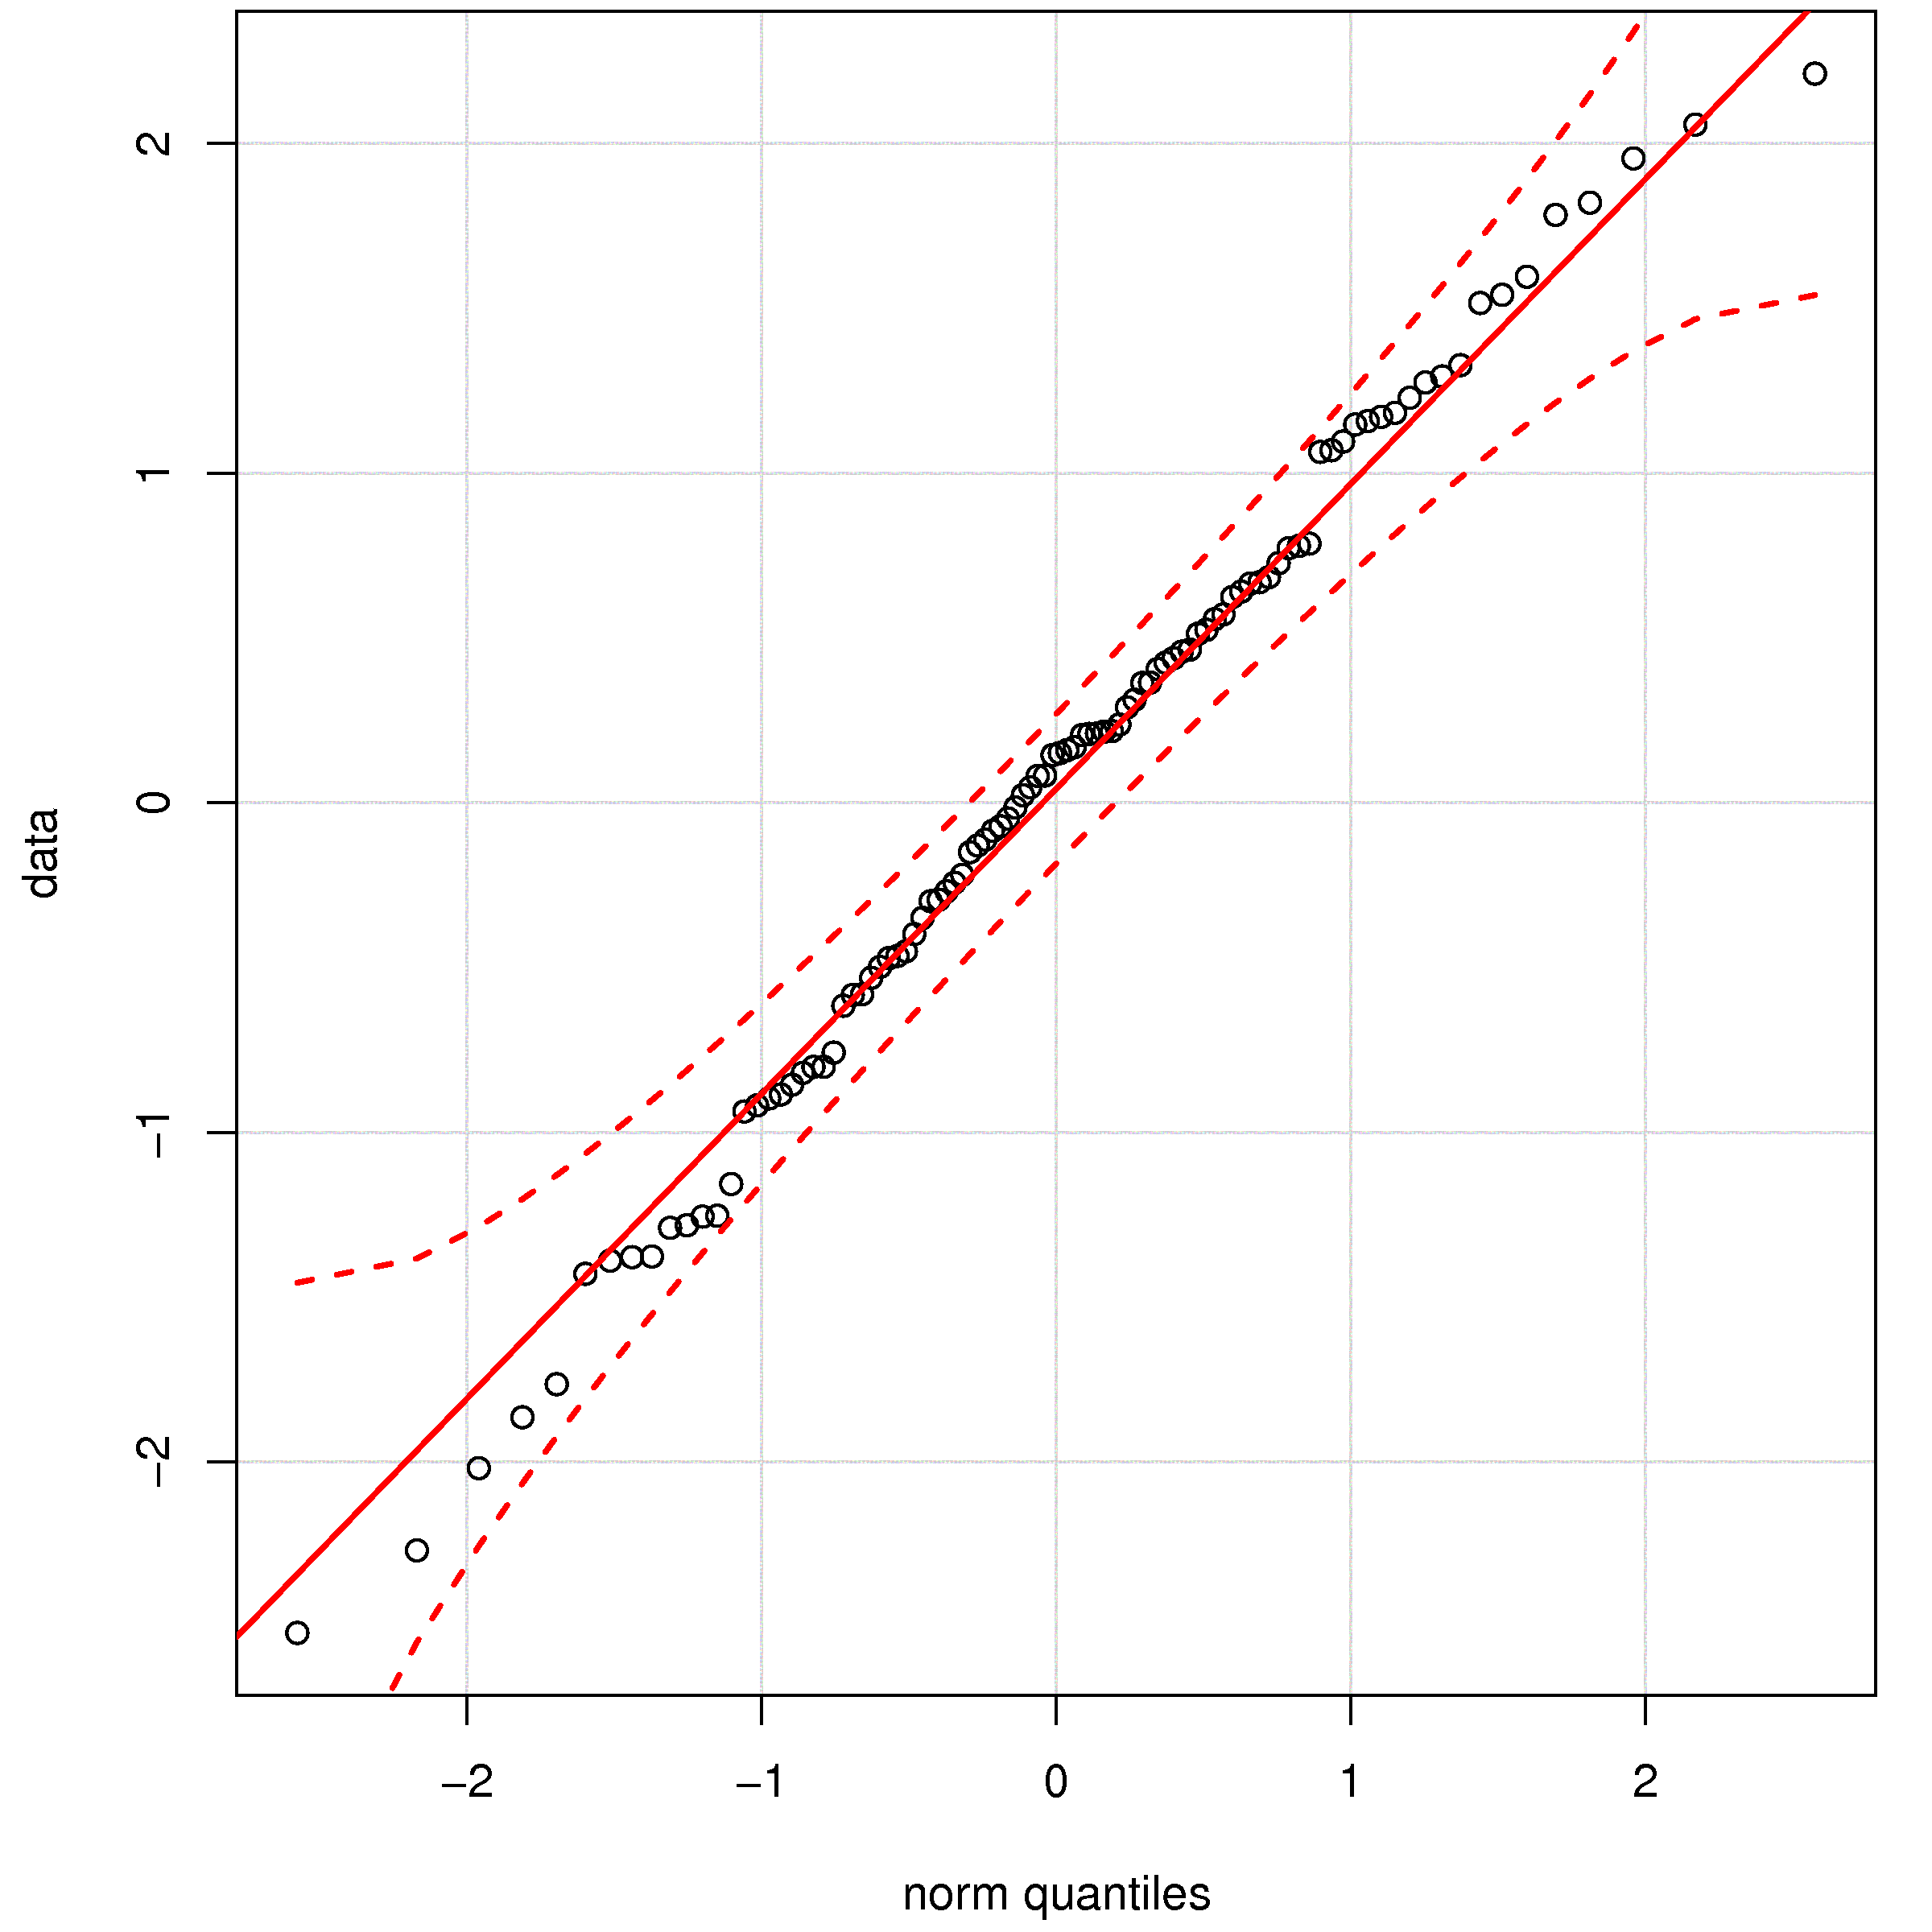
For example, the built-in ``qqnorm(...)`` can be used to test if a sequence of values came from a normal distribution. However, there is, in my opinion, a better qq-plot function in the ``car`` library, called ``qqPlot(...)``, however the ``car`` library does *not* come pre-installed with R.
This section shows how to install extra packages and to keep your R installation up to date.
Keeping R up to date
Even if you don't want to install extra packages, you should keep the built-in packages up to date. You require an internet connection for this step.
.. rubric:: The manual approach is to write, at the R command prompt:
.. code-block:: s
update.packages()
.. rubric:: Or you can follow these steps in RStudio:
- Click on ``Tools`` on the top menu
- Then choose ``Check for Package Updates...``
- If this is your first time updating, then you will have to select the closest update mirror (web site).
- Typically you would choose the mirror that is geographically closest to you: for example ``Canada (ON)``. You can have R remember your choice for the future.
- Click on the ``Install`` button to have R update all your packages to their latest version.
R will fetch and install any updates it requires.
Installing a new package
Installing a new package is easy; finding the package to install that does what you want is a little tougher: there are over 2000 packages available. Here are 2 ways I typically discover packages.
- . By browsing the hierarchy of packages at http://cran.r-project.org/web/views/
- . Googling: for example, the other day I needed to figure out how to plot time-series data nicely. I came across a page that recommended the ``xts`` package.
- Click on ``Tools`` on the top menu
- Choose ``Install Packages...``
- Type in the name of the package you found in the prior step.
- Make sure you select the check box ``Install dependencies``
- Then click "Install"
Once the library is installed, you first need to load it. For example, to generate a nicer qq-plot using the ``car`` package:
.. code-block:: s
data <- rnorm(100) # create 100 normally distributed values library(car) qqPlot(data)
will generate: </rst>
<rst> <rst-options: 'toc' = False/> <rst-options: 'reset-figures' = False/> To see a list of all functions that are provided by a package:
.. code-block:: s
help(package="car") </rst>
