5.7. Changing one single variable at a time (COST)
How do we go about running our experiments when there is more than one variable present that affects our outcome, \(y\)? In this section we describe how not to do it.
You will certainly have seen the recommendation that we must change one single variable at a time (COST):
Something goes wrong with a recipe: for example, the pancakes are not as fluffy as normal, or the muffins don’t rise as much as they should. You are convinced it is the new brand of all-purpose flour you recently bought. You change only the flour the next time you make pancakes to check your hypothesis.
University labs are notorious for asking you to change one variable at a time. The reason is that these labs intend for you to learn what the effect of a single variable is on some other variable (e.g. change temperature in a distillation column to improve product purity). The labs teach you that this is good scientific procedure, which is fine if your goal is to only initially learn about a system, especially a new system that has never been explored.
However, when you want to optimize and improve a process, then a different style of experiments is required, where multiple factors are changed simultaneously.
We have known since the mid-1930s (almost 85 years), due to the work by R. A. Fisher, that changing one factor at a time (OFAT) is not an efficient way for experimentation. Note that OFAT is an alternative name for COST, and an example of OFAT is illustrated in the figure.
Consider a bioreactor where we are producing a particular enzyme. The yield, our outcome variable, is known to be affected by these six variables: dissolved oxygen level, agitation rate, reaction duration, feed substrate concentration, substrate type and reactor temperature. For illustration purposes, let’s assume that temperature and feed substrate concentration are chosen, as they have the greatest effect on yield. The goal would be to maximize the yield.
The base operating point is 346 K with a feed substrate concentration of 1.5 g/L, marked with a circle in the figure below. At these conditions, we report a yield from the reactor of approximately 63%.
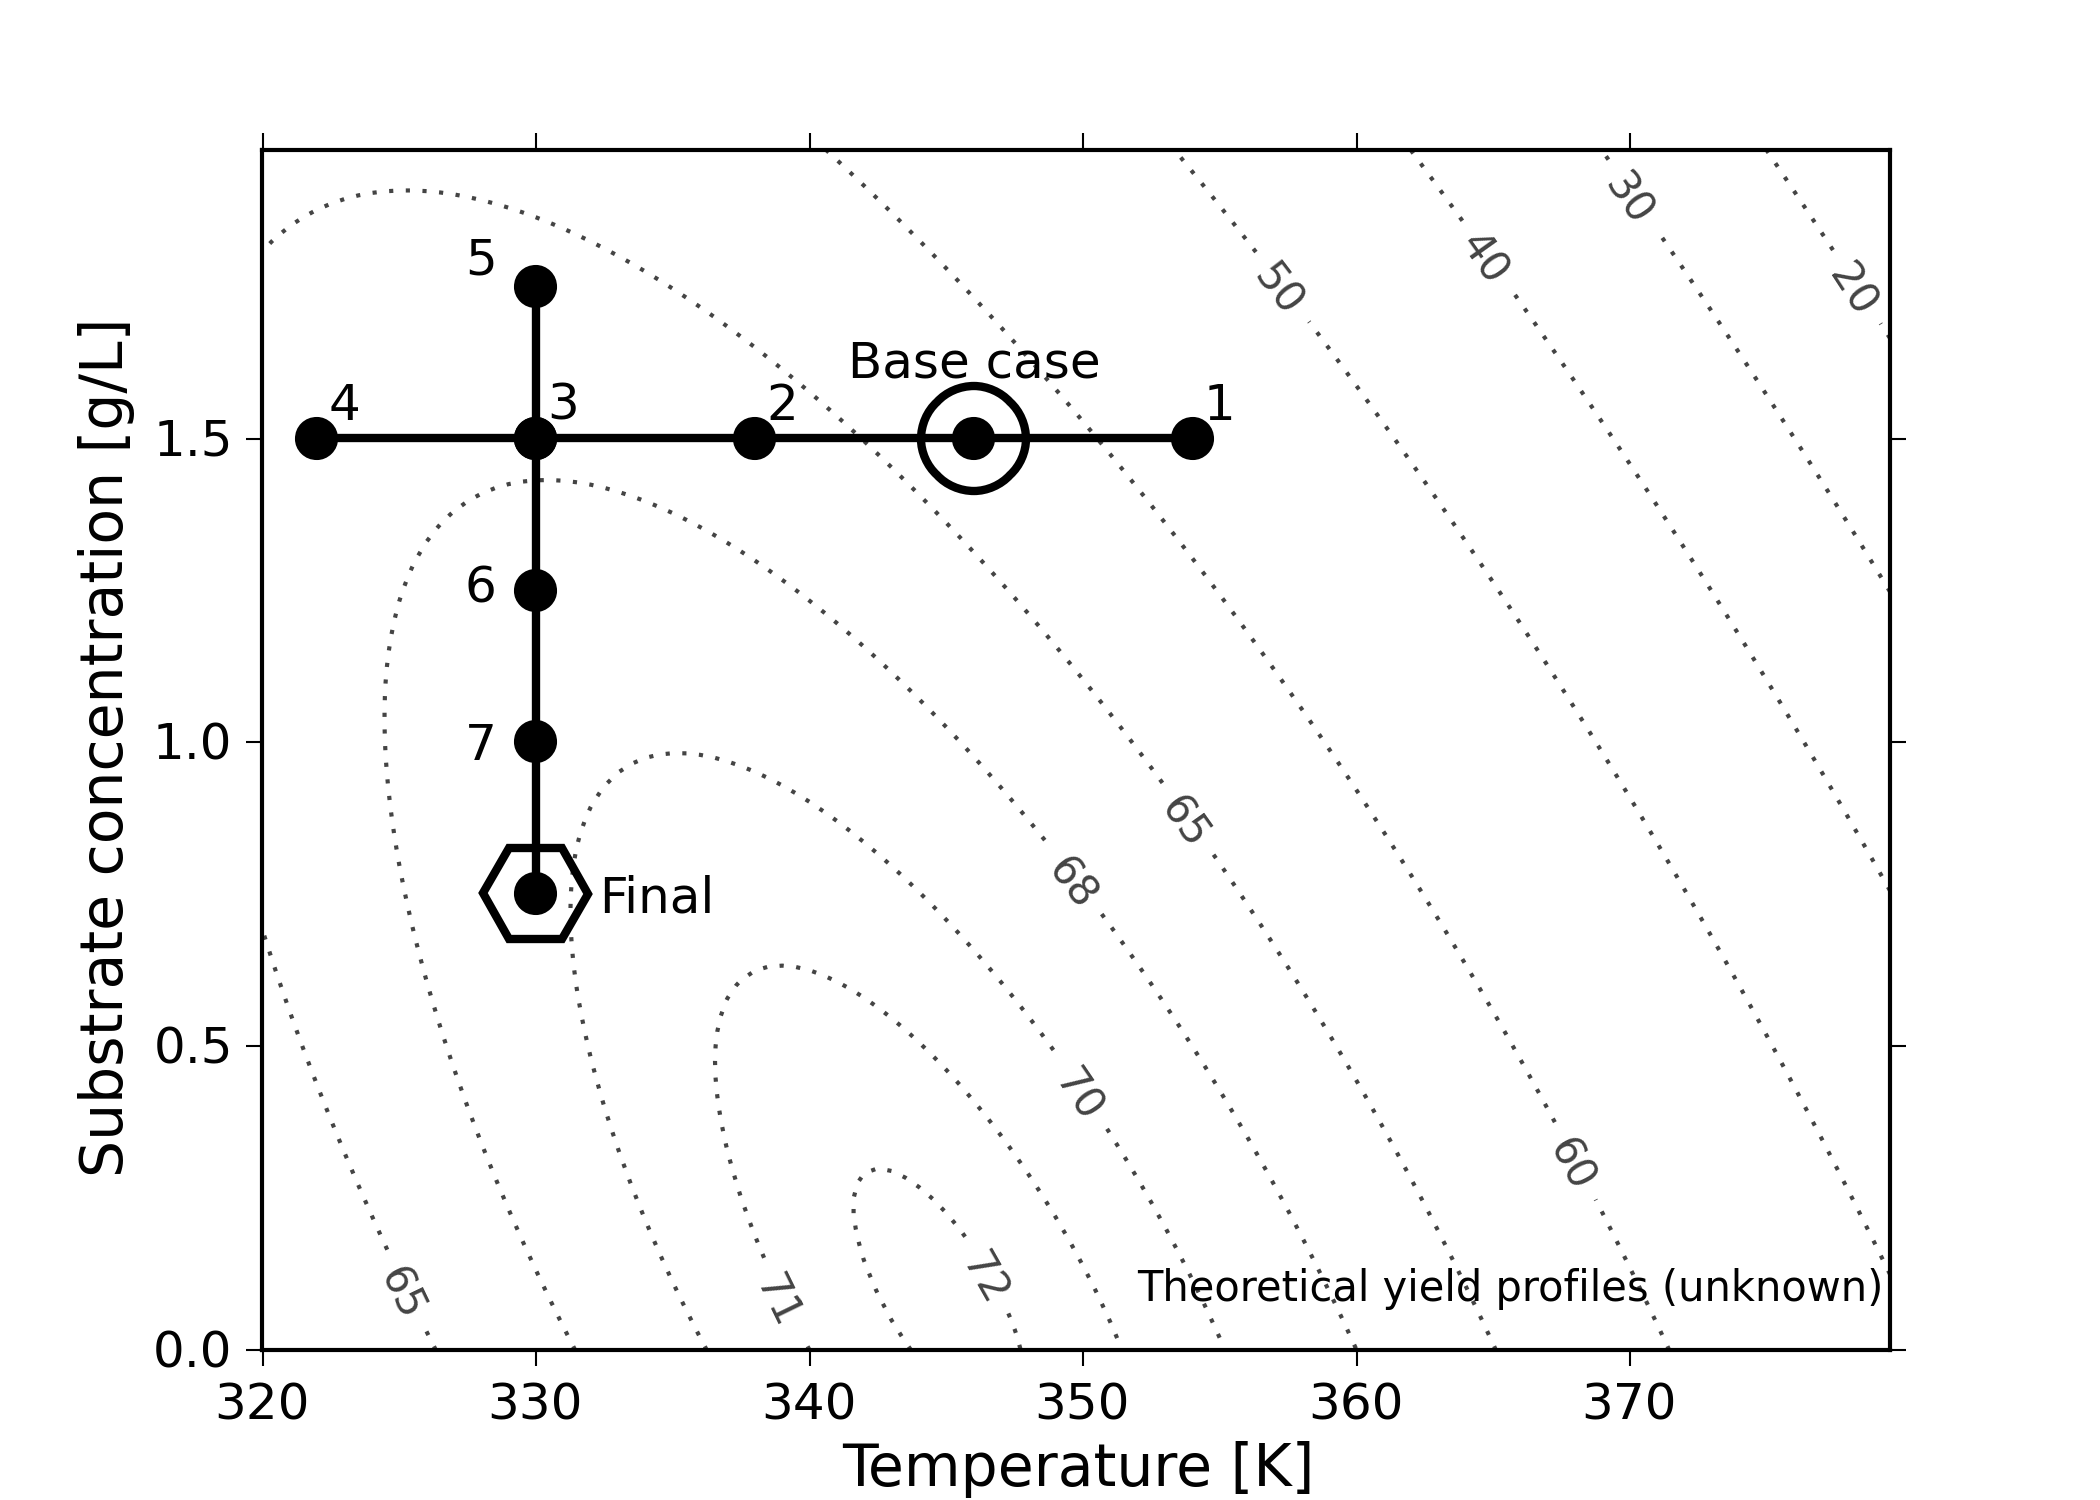
At this point, we start to investigate the effect of temperature. We decide to move up by 10 degrees to 356 K, marked as point 1. After running the experiment, we record a lower yield value than our starting point. So we go in the other direction and try temperatures at 338 K, 330 K and 322 K. We are happy that the yields are increasing, but experiment 4 shows a slightly lower yield. So we figure that we’ve reached a plateau in terms of the temperature variable. Our manager is pretty satisfied because we’ve boosted yield from 63% to around 67%. These four runs have cost us around $10,000 in equipment time and manpower costs so far.
We now get approval to run four more experiments, and we decide to change the substrate feed concentration. But we’re going to do this at the best temperature found so far, 330 K, at run 3. Our intuition tells us that higher feed concentrations should boost yield, so we try 1.75 g/L. Surprisingly, that experiment lowers the yield. There’s likely something we don’t understand about the reaction mechanism. Anyhow, we try the other direction, down to 1.25 g/L, and we see a yield increase. We decide to keep going, down to 1.0 g/L, and finally to 0.75 g/L. We see very little change between these last two runs, and we believe we have reached another plateau. Also, our budget of eight experimental runs is exhausted.
Our final operating point chosen is marked on the plot with a hexagon, at 330 K and 0.75 g/L. We’re proud of ourselves because we have boosted our yield from 63% to 67%, and then from 67% to 69.5%. We have also learned something interesting about our process: the temperature appears to be negatively correlated with yield, and the substrate concentration is negatively correlated with yield. An unexpected observation!
The problem with this approach is that it leaves undiscovered values behind. Changing one single variable at a time leads you into thinking you’ve reached the optimum, when all you’ve done in fact is trap yourself at a suboptimal solution.
Furthermore, notice that we would have got a completely different outcome had we decided to first change substrate concentration, \(S\), and then temperature, \(T\). We would have likely landed closer to the optimum. This is very unsatisfactory: we cannot use methods to optimize our processes that depend on the order of experiments!
We have not yet even considered the effect of the other four variables of dissolved oxygen level, agitation rate, reaction duration and substrate type. We have suboptimally optimized the system in two dimensions, but there are in fact six dimensions. Although the OFAT (or COST) approach can get you close to the optimum in two variables, you have little to no hope of using this approach successfully with multiple factors.
Designed experiments, on the other hand, provide an efficient mechanism to learn about a system, often in fewer runs than the COST approach, and avoid misleading conclusions that might be drawn from the COST approach. Designed experiments are always run in random order – as we will presently see – and we will get the same result, no matter the order.