2.3. What is variability?
Life is pretty boring without variability, and this book, and almost all the field of statistics would be unnecessary if things did not naturally vary.
Fortunately, we have plenty of variability in the recorded data from our processes and systems:
Raw material properties are not constant.
Unknown sources, often called “error” (note that the word error in statistics does not have the usual negative connotation from English). These errors are all sources of variation which our imperfect knowledge of the process cannot account for.
Measurement and sampling variability: sensor drift, spikes, noise, recalibration shifts, errors in our sample analysis and laboratory equipment.

Production disturbances:
external conditions change, such as ambient temperature, or humidity, and
pieces of plant equipment break down, wear out and are replaced.
Feedback control systems introduce variability in your process, in order to reduce variability in another part of the process. Think of what a feedback control system does. See page 222 or page 879 of the freely available textbook by Dr. Thomas Marlin for visual illustrations.
Operating staff: introduce variability into a process in feedback manner (i.e. they react to process upsets) or in a feed-forward manner, for example, to preemptively act on the process to counteract a known disturbance. By doing so they introduce variability into a process.
All this variability, although a good opportunity to keep many of use employed, comes at a price as described next.
2.3.1. The high cost of variability in your final product
- Assertion
Customers expect both uniformity and low cost when they buy your product. Variability defeats both objectives.
Three broad outcomes are possible when you sell a highly variable product:
The customer may be totally unable to use your product for the intended purpose. Imagine a food ingredient such as fresh milk, or a polymer with viscosity that is too high, or a motor oil with unsuitable properties that causes engine failure.
Your product leads to poor performance. The user must compensate for the poor properties through additional cost: more energy will be required to work with a polymer whose melting point is higher than expected, longer reaction times will be required if the catalyst purity is not at specification.
Your brand is diminished: your products, even though acceptable will be considered with suspicion in the future.
An extreme example was the food poisoning and deaths that occurred due to the listeriosis outbreak at Maple Leaf Foods, Canada in 2008. The bacterial count in food products is always non-zero, however the established tolerance limits were exceeded during this outbreak.
Another example was the inadvertent acceleration that occurred in some Toyota car models in 2010. It is still uncertain whether this was manufacturer error or driver error.
In addition to the risk of decreasing your market share (see the above 3 points), variability in your product also has these costs:
Inspection costs: to mitigate the above risks you must inspect your product before you ship it to your customers. It is prohibitively expensive and inefficient to test every product (known as “inspecting quality into your product”). A production line with low variability on the other hand, requires less inspection of every product.
The pharmaceutical industry is well known to be inefficient in this respect, with terms such as “100% inspection” and even “200% inspection”. Furthermore, some types of inspection are destructive, and therefore 100% inspection is not feasible.
Off-specification products: must be reworked, disposed of, or sold at a loss or much lower profit. These costs are ultimately passed onto your customers, costing you money.
Note: the above discussion assumes that you are able to quantify product quality with one or more univariate quality metrics and that these metrics are independent of each other. Quality is almost always a multivariate attribute of the product. We will discuss the use of multivariate methods to judge product quality later.
2.3.2. The high cost of variability in your raw materials
Turning the above discussion around, with you on the receiving end of a highly variable raw material:
If you do not implement any sort of process control system, then any variability in these raw materials that you receive and process is manifest as variability in your final product. This usually shows up in proportion: higher variability in the inputs results in higher variability in the product quality.
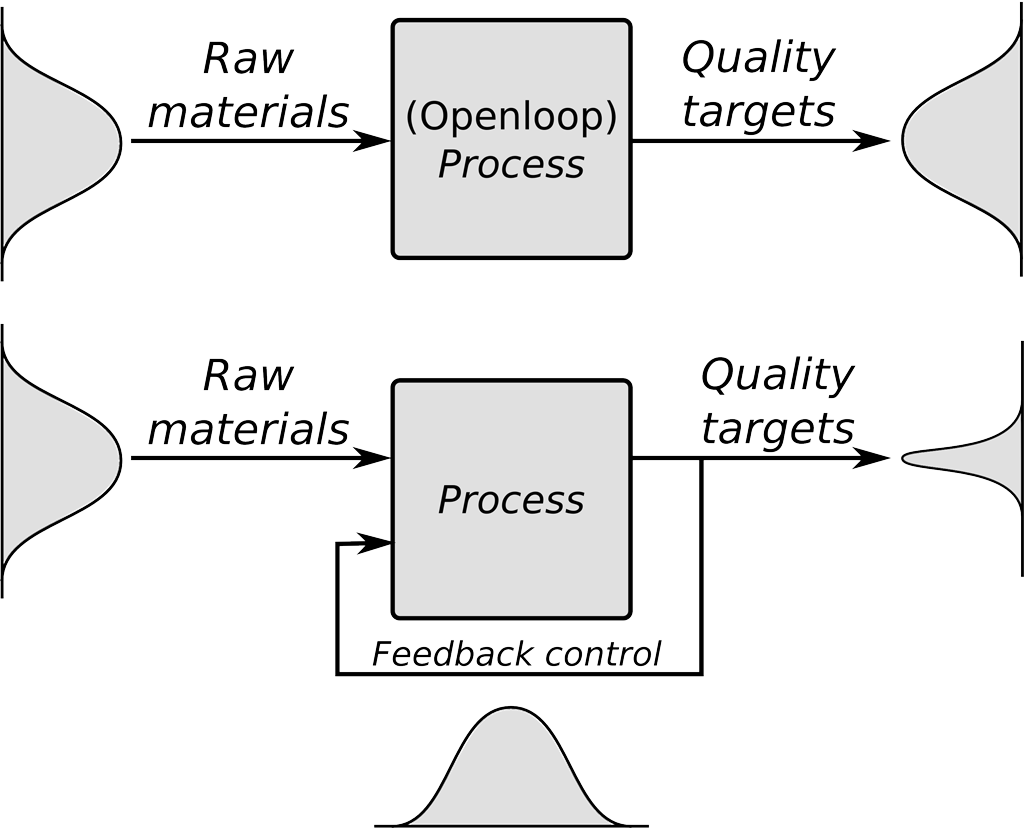
Even if you do take feedback or feed-forward corrective control: you have to incur additional cost, since you have to process materials that are not to specification: this will require energy and/or time, reducing your profit due to the supplier’s raw material variability.
Note: Feedback control around a given set point can be seen as introducing additional variation into a process to counteract other sources of variation (called disturbances in the process control lingo). This is done with the hope of reducing the output variability.
2.3.3. Dealing with variability
So, how do we make progress despite this variability? This whole book, and all of statistical data analysis, is about variability:
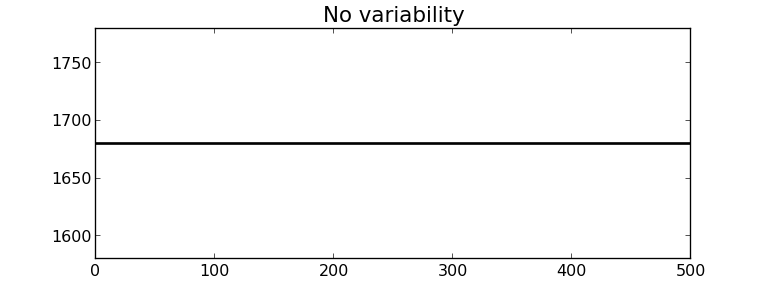
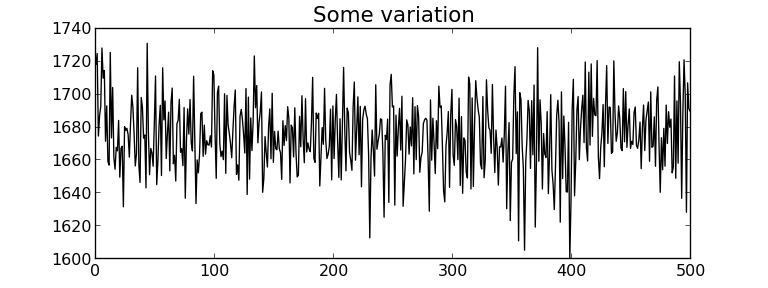
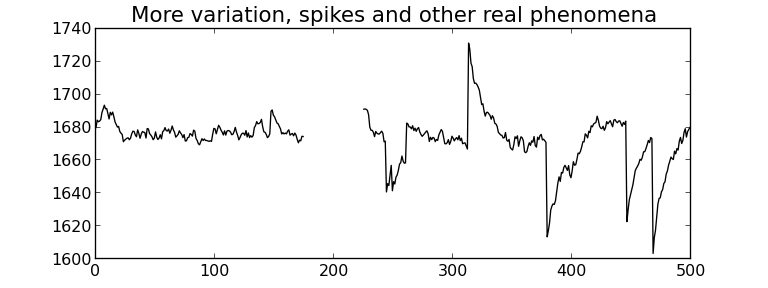
in the data visualization section we gave some hints how to plot graphics that show the variability in our process clearly
in this chapter we learn how to quantify variability and then compare variability
later we consider how to construct monitoring charts to track variability
in the section on least squares modelling we learn how variation in one variable might affect another variable
with designed experiments we intentionally introduce variation into our process to learn more about the process (e.g. so that we can optimize our process for improved profitability); and
and in the latent variable modelling section we learn how to deal with multiple variables, simultaneously extracting information from the data to understand how variability affects the process.