2.1. Univariate data analysis in context
This section gives a starting idea to the general area of data analysis. We cover concepts from univariate data analysis shown in the pictorial outline below. This section is only a review of these concepts for one single variable. If you have more than one variable, you can repeat the analysis for each one. Later, in the multivariate chapter, we learn how to extract information from multiple variables at the same time.
Some introductory statistics textbooks, for more detailed background, are recommend further down.
2.1.1. Usage examples
The material in this section is used whenever you want to learn more about a single variable in your data set. For example:
Co-worker: Here are the final output values, on a scale from 0 to 100%, from a batch system for the last 3 years (1256 data points).
What sort of distribution do the data have?
Yesterday our output value was less than 50%, what are the chances of that happening under typical conditions?
Yourself: We have historical failure rate data for certain equipment in our factories. What is the probability that 3 of the same type of equipment will fail this year?
Manager: We have 2 duplicate reactors. Does reactor 1 have better final product purity, on average, than reactor 2?
Colleague: What does the 95% confidence interval for the density of our powder ingredient really mean?
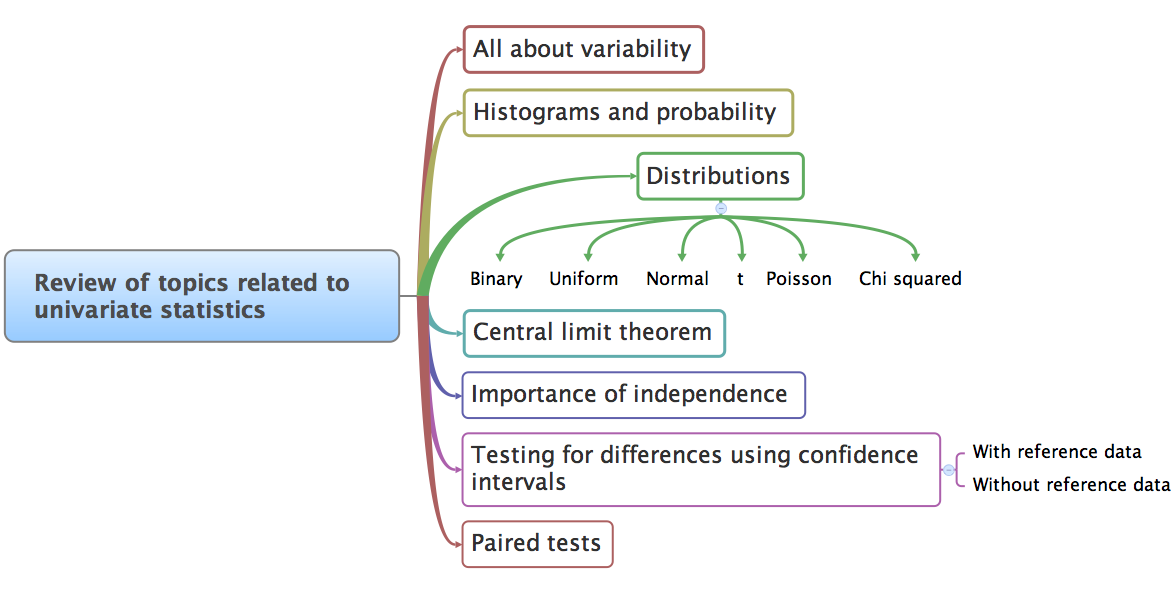
2.1.2. What we will cover
2.2. References and readings
Any standard statistics text book will cover the topics from this part of the book in much greater depth than these notes. Some that you might refer to:
Recommended: Box, Hunter and Hunter, Statistics for Experimenters, Chapter 2.
Hodges and Lehmann, Basic Concepts of Probability and Statistics.
Hogg and Ledolter, Engineering Statistics.
Montgomery and Runger, Applied Statistics and Probability for Engineers.