2.7. Uniform distribution
A uniform distribution arises when an observation’s value is equally as likely to occur as all the other options of the recorded values. The classic example are dice: each face of a die is equally as likely to show up as any of the other faces. This forms a discrete, uniform distribution.
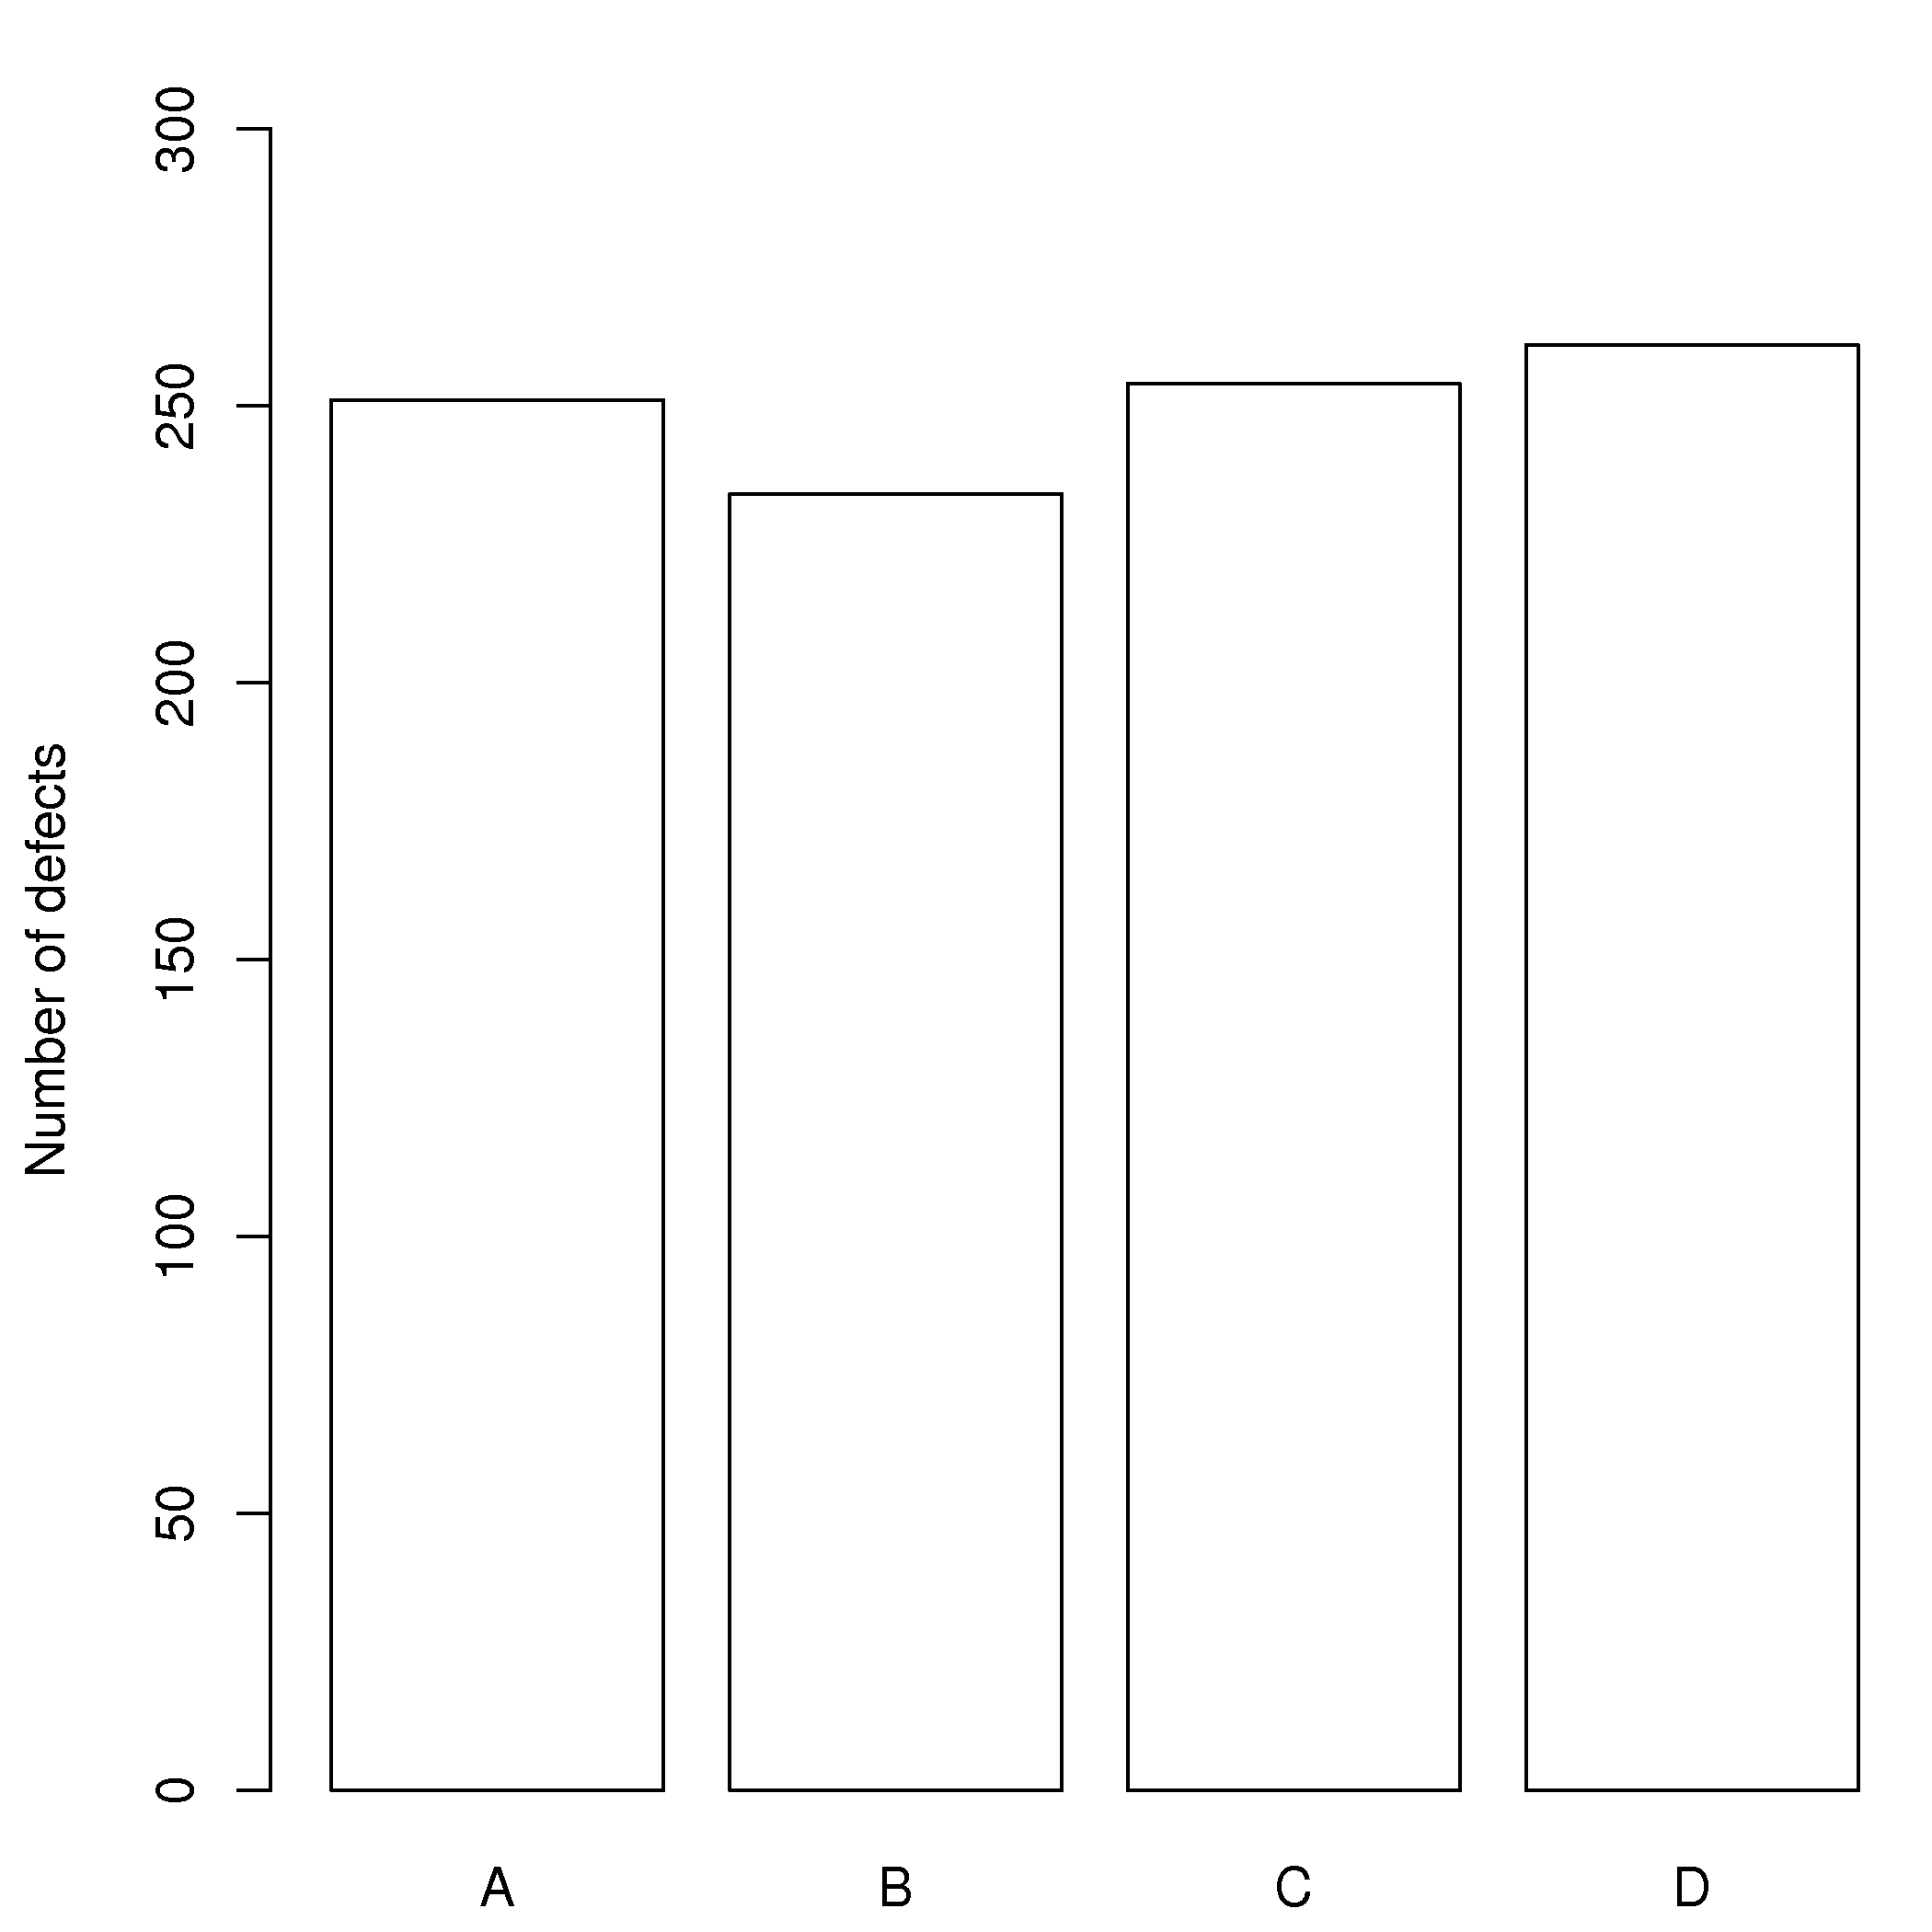
The histogram for an event with 4 possible outcomes that are uniformly distributed is shown below. Notice that the sample histogram will not necessarily have equal bar heights for all categories (bins), especially for small sample sizes.
You can simulate uniformly distributed random numbers in most software packages. As an example, to generate 50 uniformly distributed random integers between 2 and 10, inclusive, in various languages:
A continuous, uniform distribution arises when there is equal probability of every measurement occurring within a given lower- and upper-bound. This sort of phenomena is not often found in practice. Usually, continuous measurements follow some other distribution, of which we will discuss the normal and \(t\)-distribution next.