3.3. What is process monitoring about?
Most industries have now realized that product quality is not an option. There was historical thinking that quality is the equivalent of “gold-plating” your product, but that has mostly fallen away. Product quality is not always a cost-benefit trade-off: it is beneficial to you in the long-term to improve your product quality, and for your customers as well.
As we spoke about in the univariate review section, good quality products (low variability) actually boost your profits by lowering costs in the long term. You have lower costs when you do not have to scrap off-specification product, or have to rework bad product. You have increased long-term sales with more loyal customers and improved brand reputation as a reliable and consistent supplier.
An example that most people in North America can relate to is the rise in Asian car manufacturers’ market share, at the expense American manufacturers’ market share. The market has the perception that Asian cars are more reliable than American cars and resale rates certainly reflect that. The perception has started to change since 2010, as North American manufacturers have become more quality conscious. That is an illustration of how lack of variability in your product can benefit you.
In order to achieve this high level of final product quality, our systems should be producing low variability product at every step of the manufacturing process. Rather than wait till the end of the process to discover poor quality product, we should be monitoring, in real-time, the purchased raw materials and also the intermediate steps in our process. When we discover unusual variability the lofty aim is to make (permanent) process adjustments to avoid that variability from ever occurring again.
Notice here that process monitoring is not intended to be automatic feedback control. It has the same principles of quantifying unusual operation (errors) and reacting to them in some way, but the intention with process monitoring is:
that any process adjustments are infrequent [not frequently on a set cycle, as feedback control does],
these adjustments are made manually [not automatically with actuators],
and take place due to special causes [not due to regularly occurring process disturbances].
As seen by the items in square brackets above, automatic feedback control is applied continuously by computer systems and makes short-term, temporary changes to the system to keep it at the desired target (called the setpoint) in the face of process disturbances. Process monitoring is very different therefore to feedback control.
Note that process monitoring is often called statistical process control (SPC). This can lead to unnecessary confusion with process control, i.e. the design and implementation of feedback control, feed-forward control and other automated control systems. We will not use the term SPC, rather we will use the term process monitoring.
3.3.1. Monitoring charts
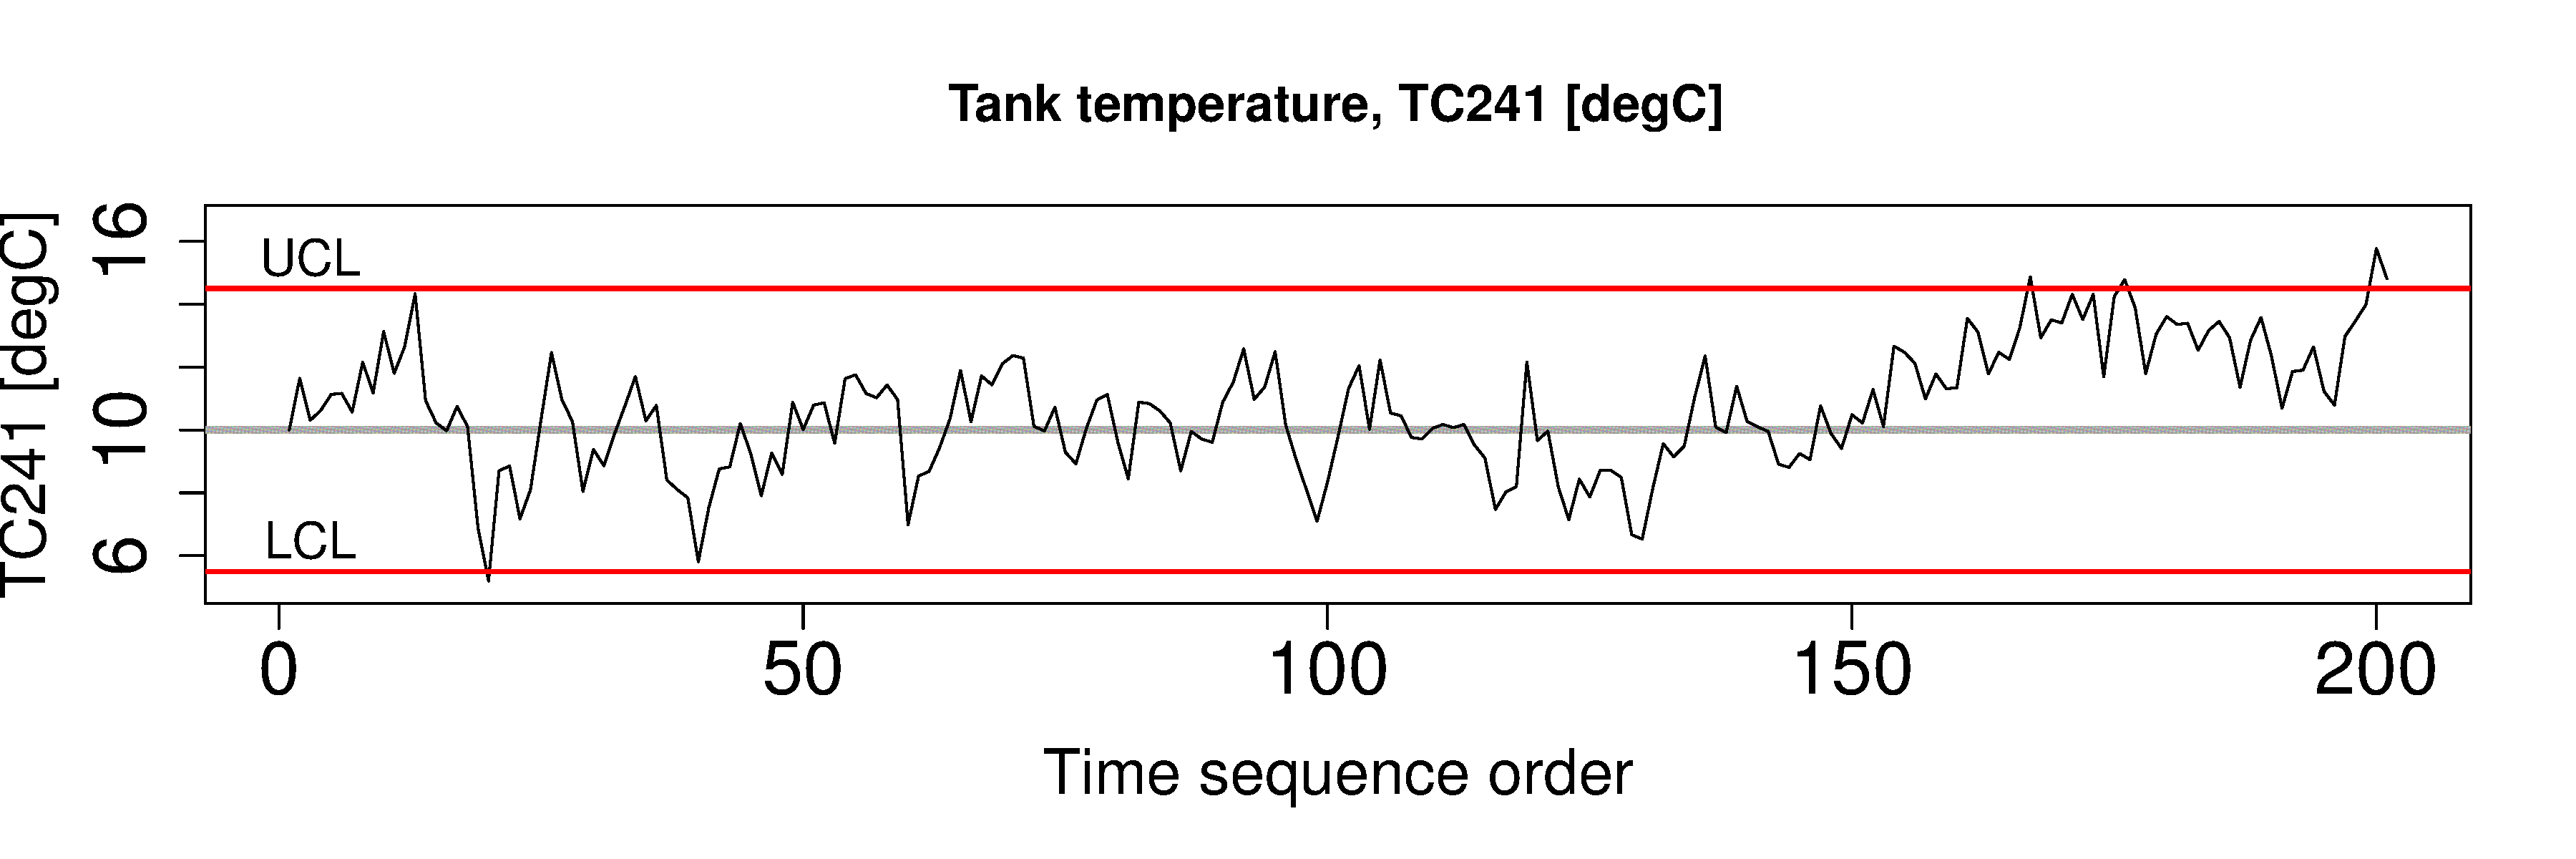
We use monitoring charts, also called control charts, to display and detect this unusual variability. A monitoring chart is a display of one value (variable), against time, or in sequence order. These time-based plots also show some additional information: usually a target value, and one or more limits lines are superimposed on the plot. The plots are most useful when displayed in real-time, or close to real-time. There are various technical ways to express what a monitoring chart does exactly, but a general definition is that a monitoring chart helps you detect outliers and other unusual time-based behaviour.
The key points are that a monitoring chart:
is most often a time-series plot, or some sort of sequence plot,
a target value (center line) may be shown,
one or more limit lines are shown, such as the UCL (upper control limit) or LCL (lower control limit),
they are displayed and updated in real-time, or as close to real-time as possible, so that the chart appears to move from right to left.
Here is an example that shows these properties.
3.3.2. General approach
Monitoring charts are developed in 2 phases. You will see the terminology of:
Phase 1: building and testing the chart from historical data that you have collected. This phase is performed off-line, it is very iterative, and you will spend most of your time here. The primary purpose of this phase is to
find portions of the data that are from stable operation
use these stable portions to calculate suitable control chart limits
ensure that your chart works as expected based on historical data
Phase 2: We use the monitoring chart on new, fresh data from the process. This phase is implemented with computer hardware and software for real-time display of the charts. This phase is skipped if the phase 1 testing is not successful (e.g. too many false alarms). We discuss reasons for failure in the section on judging the chart’s performance.
3.3.3. What should we monitor?
Any variable can be monitored. However, the purpose of process monitoring is so that you can react early to bad, or unusual operation. This implies we should monitor variables as soon as they become available, preferably in real-time. They are more suitable than variables that take a long time to acquire (e.g. laboratory measurements). We should not have to wait to the end of the production line to find our process was out of statistical control.
Data/measurements available at the start of your process, suc as raw material data from your supplier should also be monitored as soon as it is available, e.g. when received by your company, or even earlier - before the supplier ships it to you.
Intermediate variables measured from sensors at all points along the production process are (a) available much more frequently and without delay, (b) are more precise, (c) are usually more meaningful to the operating staff than final quality variables from the lab, and (d) contain the “fingerprint” of the fault, helping the engineers with diagnosis of what the problem is and point to which part(s) of the process need adjustment (see MacGregor, 1997).
Note that we do not have to monitor variables that are measured only from on-line sensors. The variable could be a calculation made from the on-line measurements.
For example, an energy balance could be calculated from various thermocouples on the process and the degree of mismatch in the energy balance could be critical to quality. For example, the mismatch could indicate an unexpected source of heat into or out of the process - so monitor that mismatch, rather than the raw temperature data. Similarly, a mass balance can be monitored in real-time, such as a total mass balance, or a carbon (or other elemental) balance. This is common in the mining industry and bio-processing industries.
Discuss one of these unit operations with your colleague. Which variables would you monitor?
Waste water treatment process
Tablet/pharmaceutical manufacturing
Oil and gas (e.g. a distillation column)
Food-processing or bio-engineering (e.g. fermentation) unit
Mineral processing plant (e.g. a flotation cell)
Plastics processing (e.g. a twin-screw extruder)
3.3.4. In-control vs out-of-control
Every book on quality control gives a slightly different viewpoint, or uses different terminology for these terms.
In this book we will take “in-control” to mean that the behaviour of the process is stable over time. Note though, that in-control does not mean the variable of interest meets the specifications required by the customer, or set by the plant personnel. All that “in control” means is that there are no special causes in the data, i.e. the process is stable. A special cause, or an assignable cause is an event that occurs to move the process, or destabilize it. Process monitoring charts aim to detect such events. The opposite of “special cause” operation is common cause operation, or stable process operation.
Note
Our objective: quickly detect abnormal variation, and fix it by finding the root cause. In this section we look at the “detection” problem. Diagnosis and process adjustment are two separate steps that follow detection.