6.5.1. Visualizing multivariate data
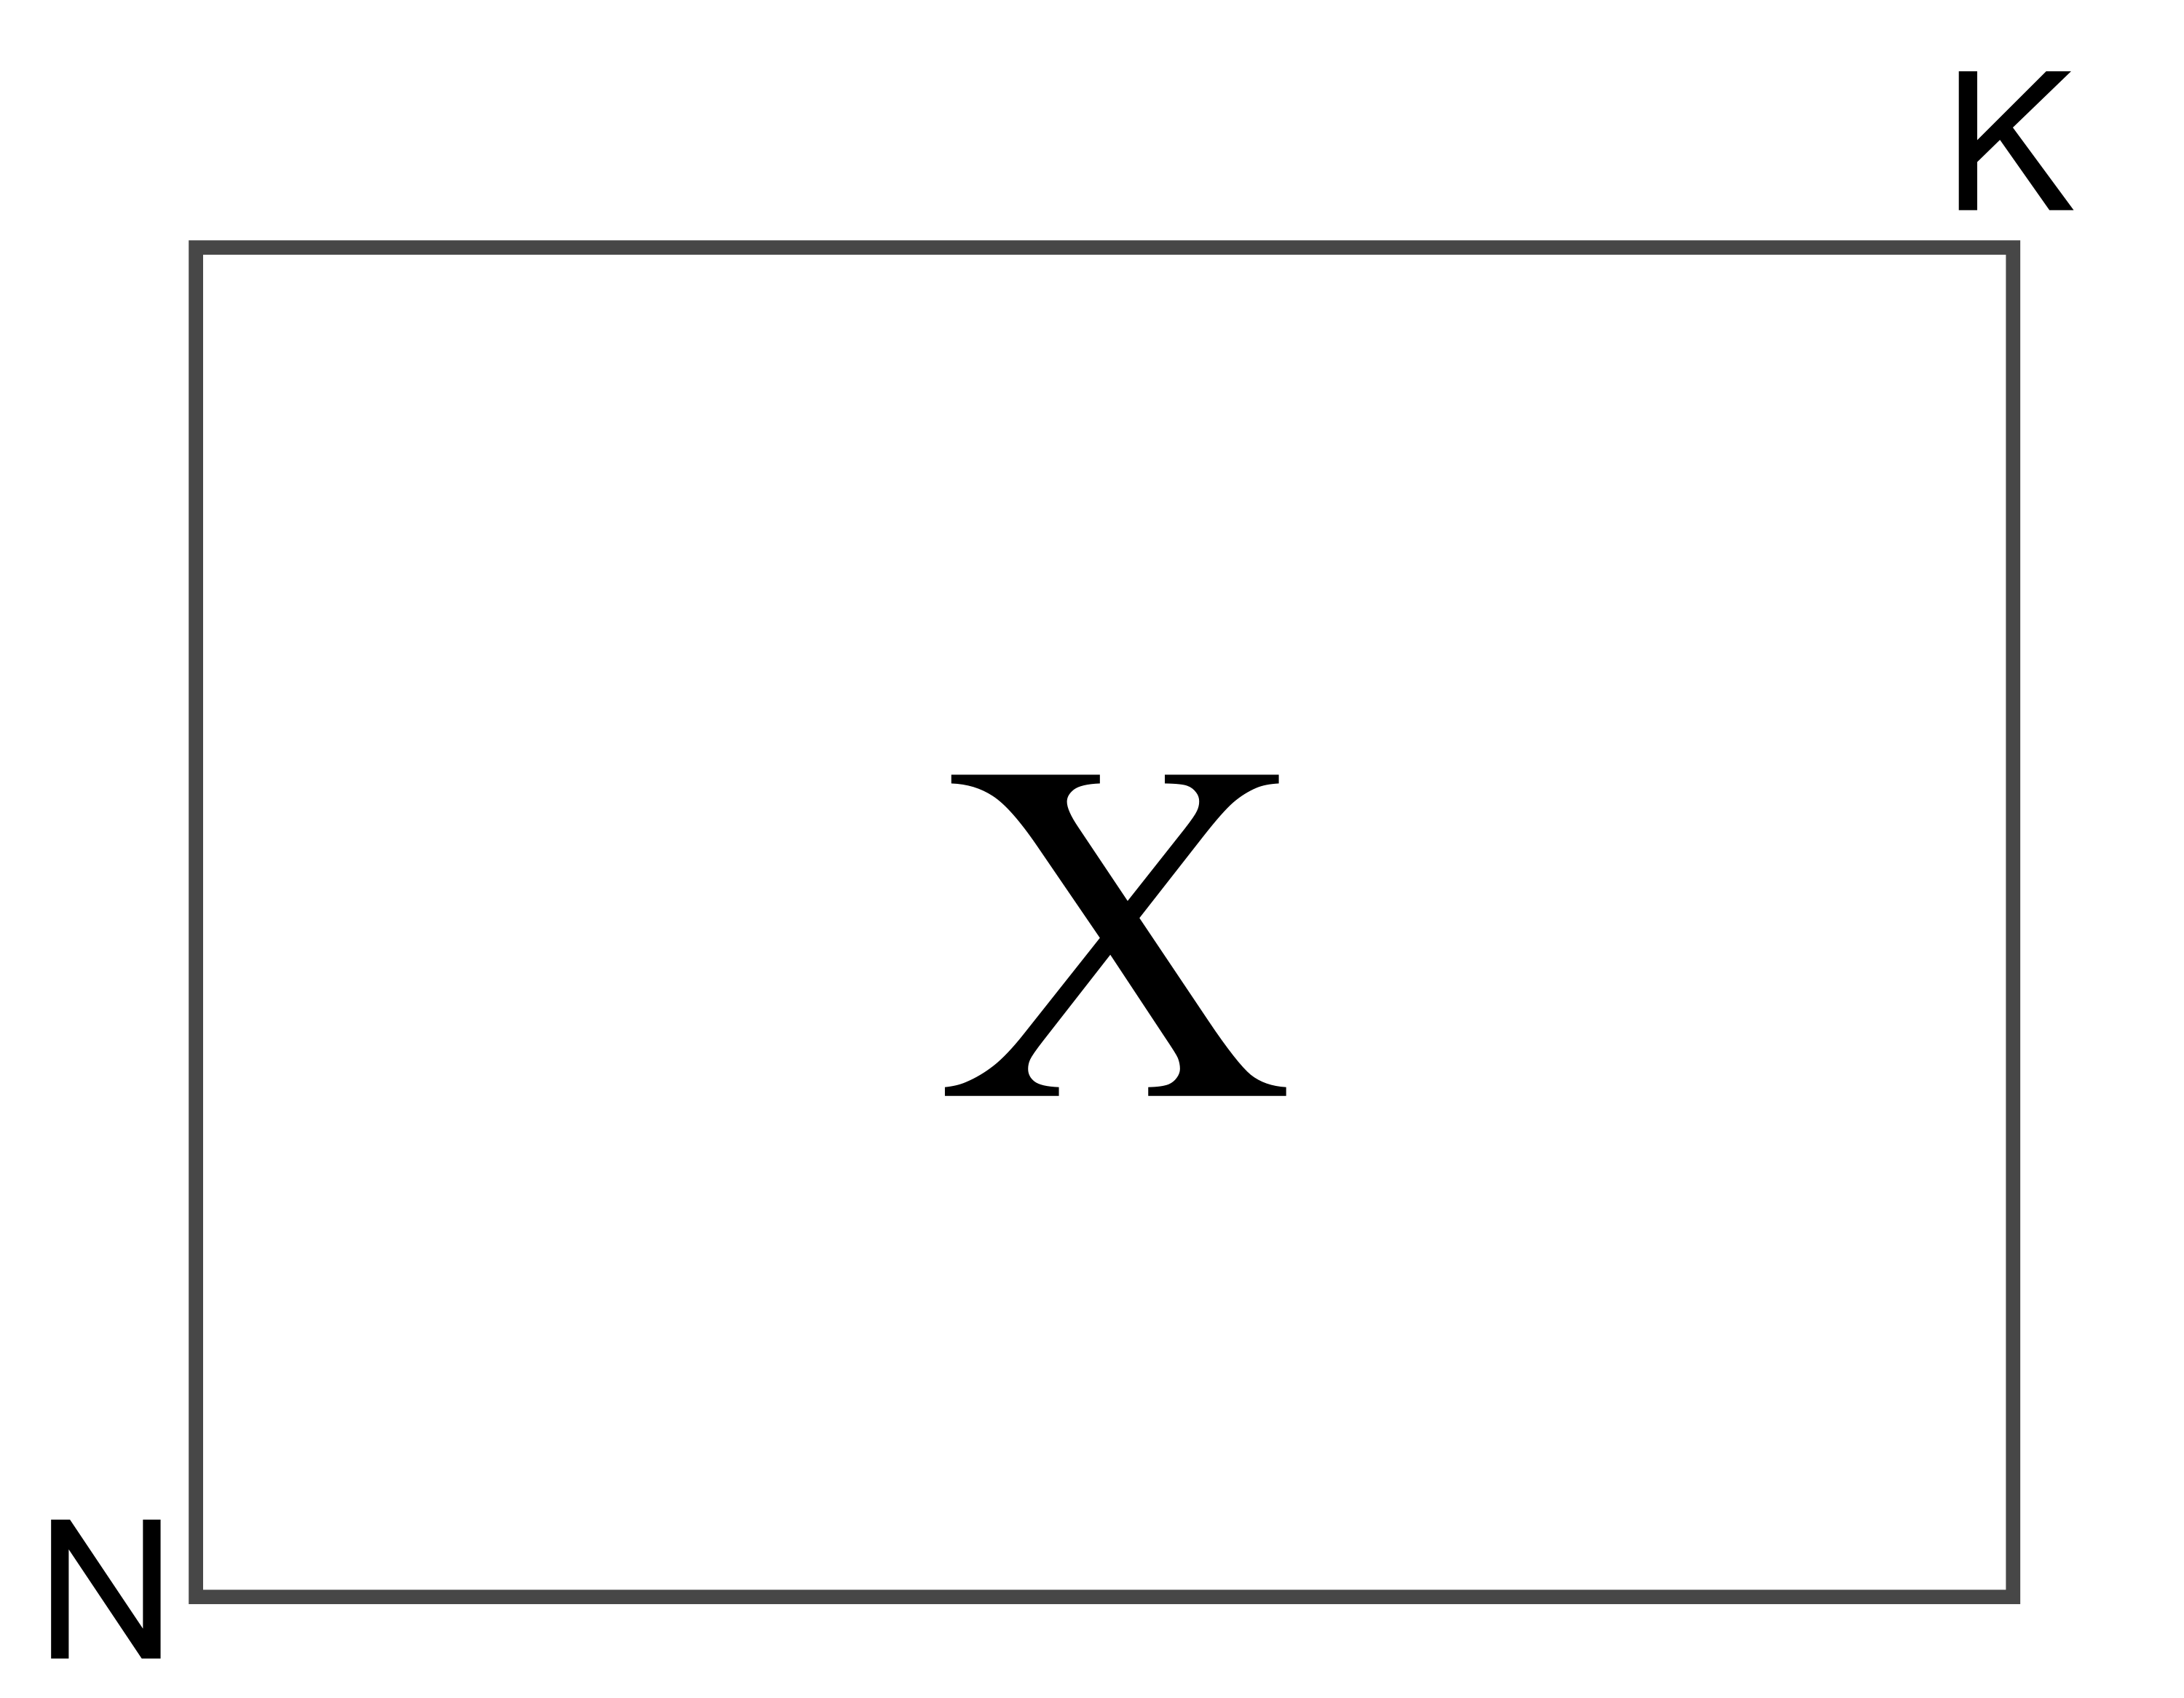
The data, collected in a matrix \(\mathbf{X}\), contains rows that represent an object of some sort. We usually call each row an observation. The observations in \(\mathbf{X}\) could be a collection of measurements from a chemical process at a particular point in time, various properties of a final product, or properties from a sample of raw material. The columns in \(\mathbf{X}\) are the values recorded for each observation. We call these the variables.
Which variables should you use, and how many observations do you require? We address this issue later. For now though we consider that you have your data organized in this manner:
Consider the case of 2 variables, \(K=2\) (left) and \(K=3\) variables (right) for the room thermometers example from earlier:
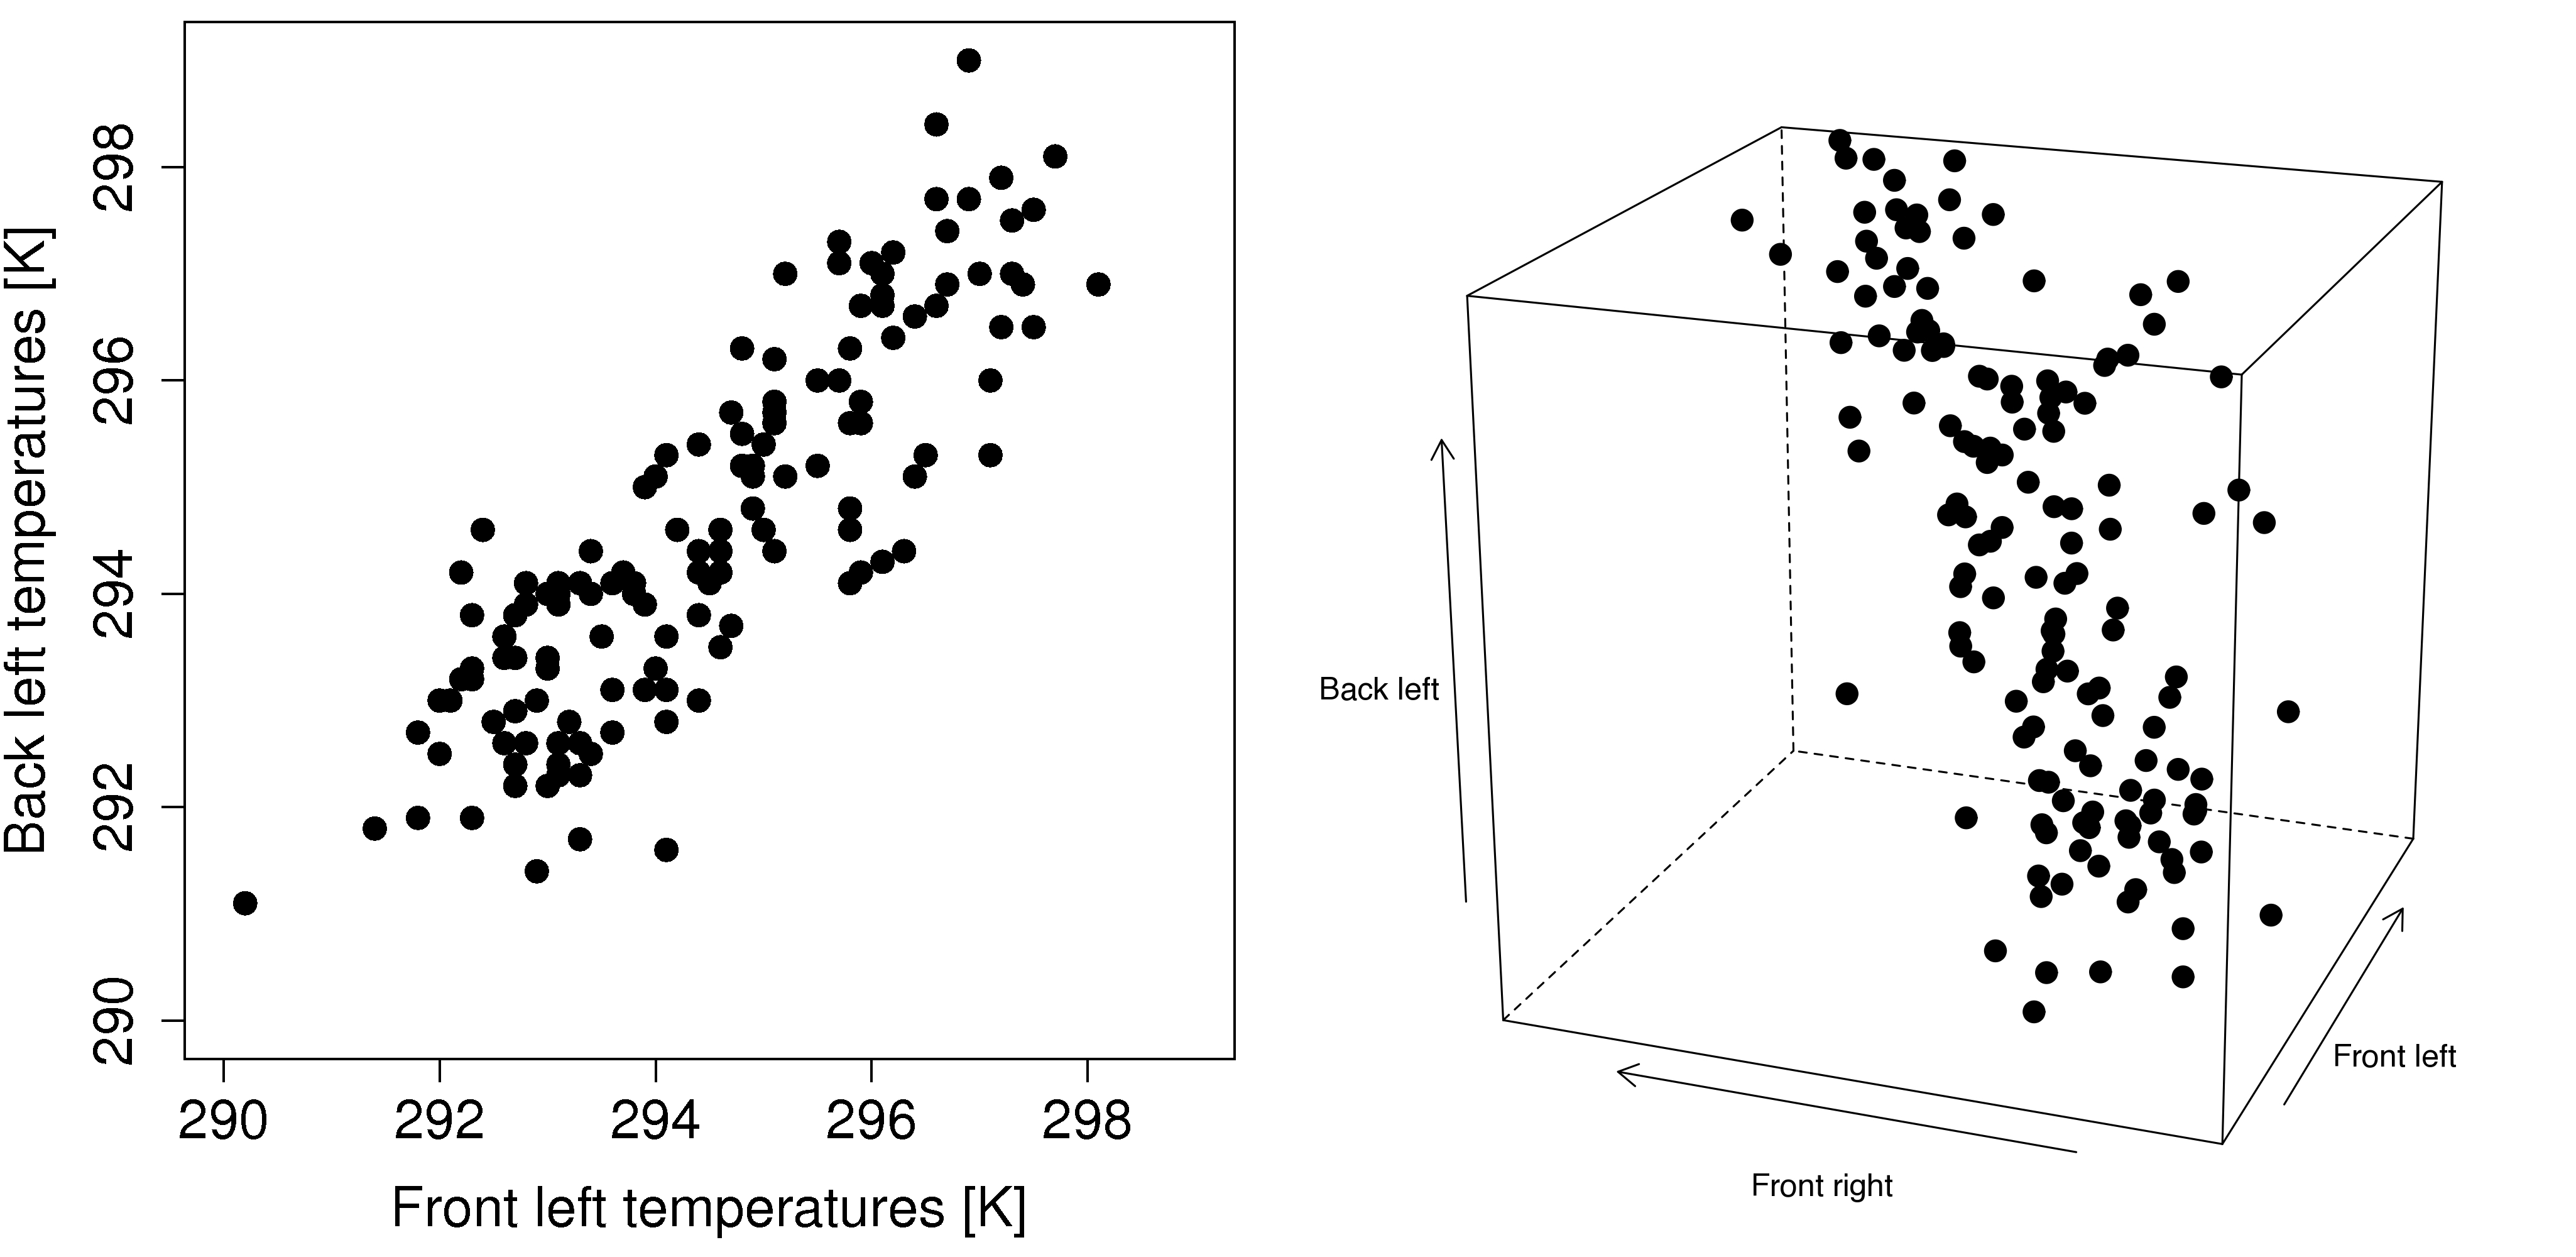
Each point in the plot represents one object, also called an observation. There are about 150 observations in each plot here. We sometimes call these plots data swarms, but they are really just ordinary scatterplots that we saw in the visualization section. Notice how the variables are correlated with each other, there is a definite trend. If we want to explain this trend, we could draw a line through the cloud swarm that best explains the data. This line now represents our best summary and estimate of what the data points are describing. If we wanted to describe that relationship to our colleagues we could just give them the equation of the best-fit line.
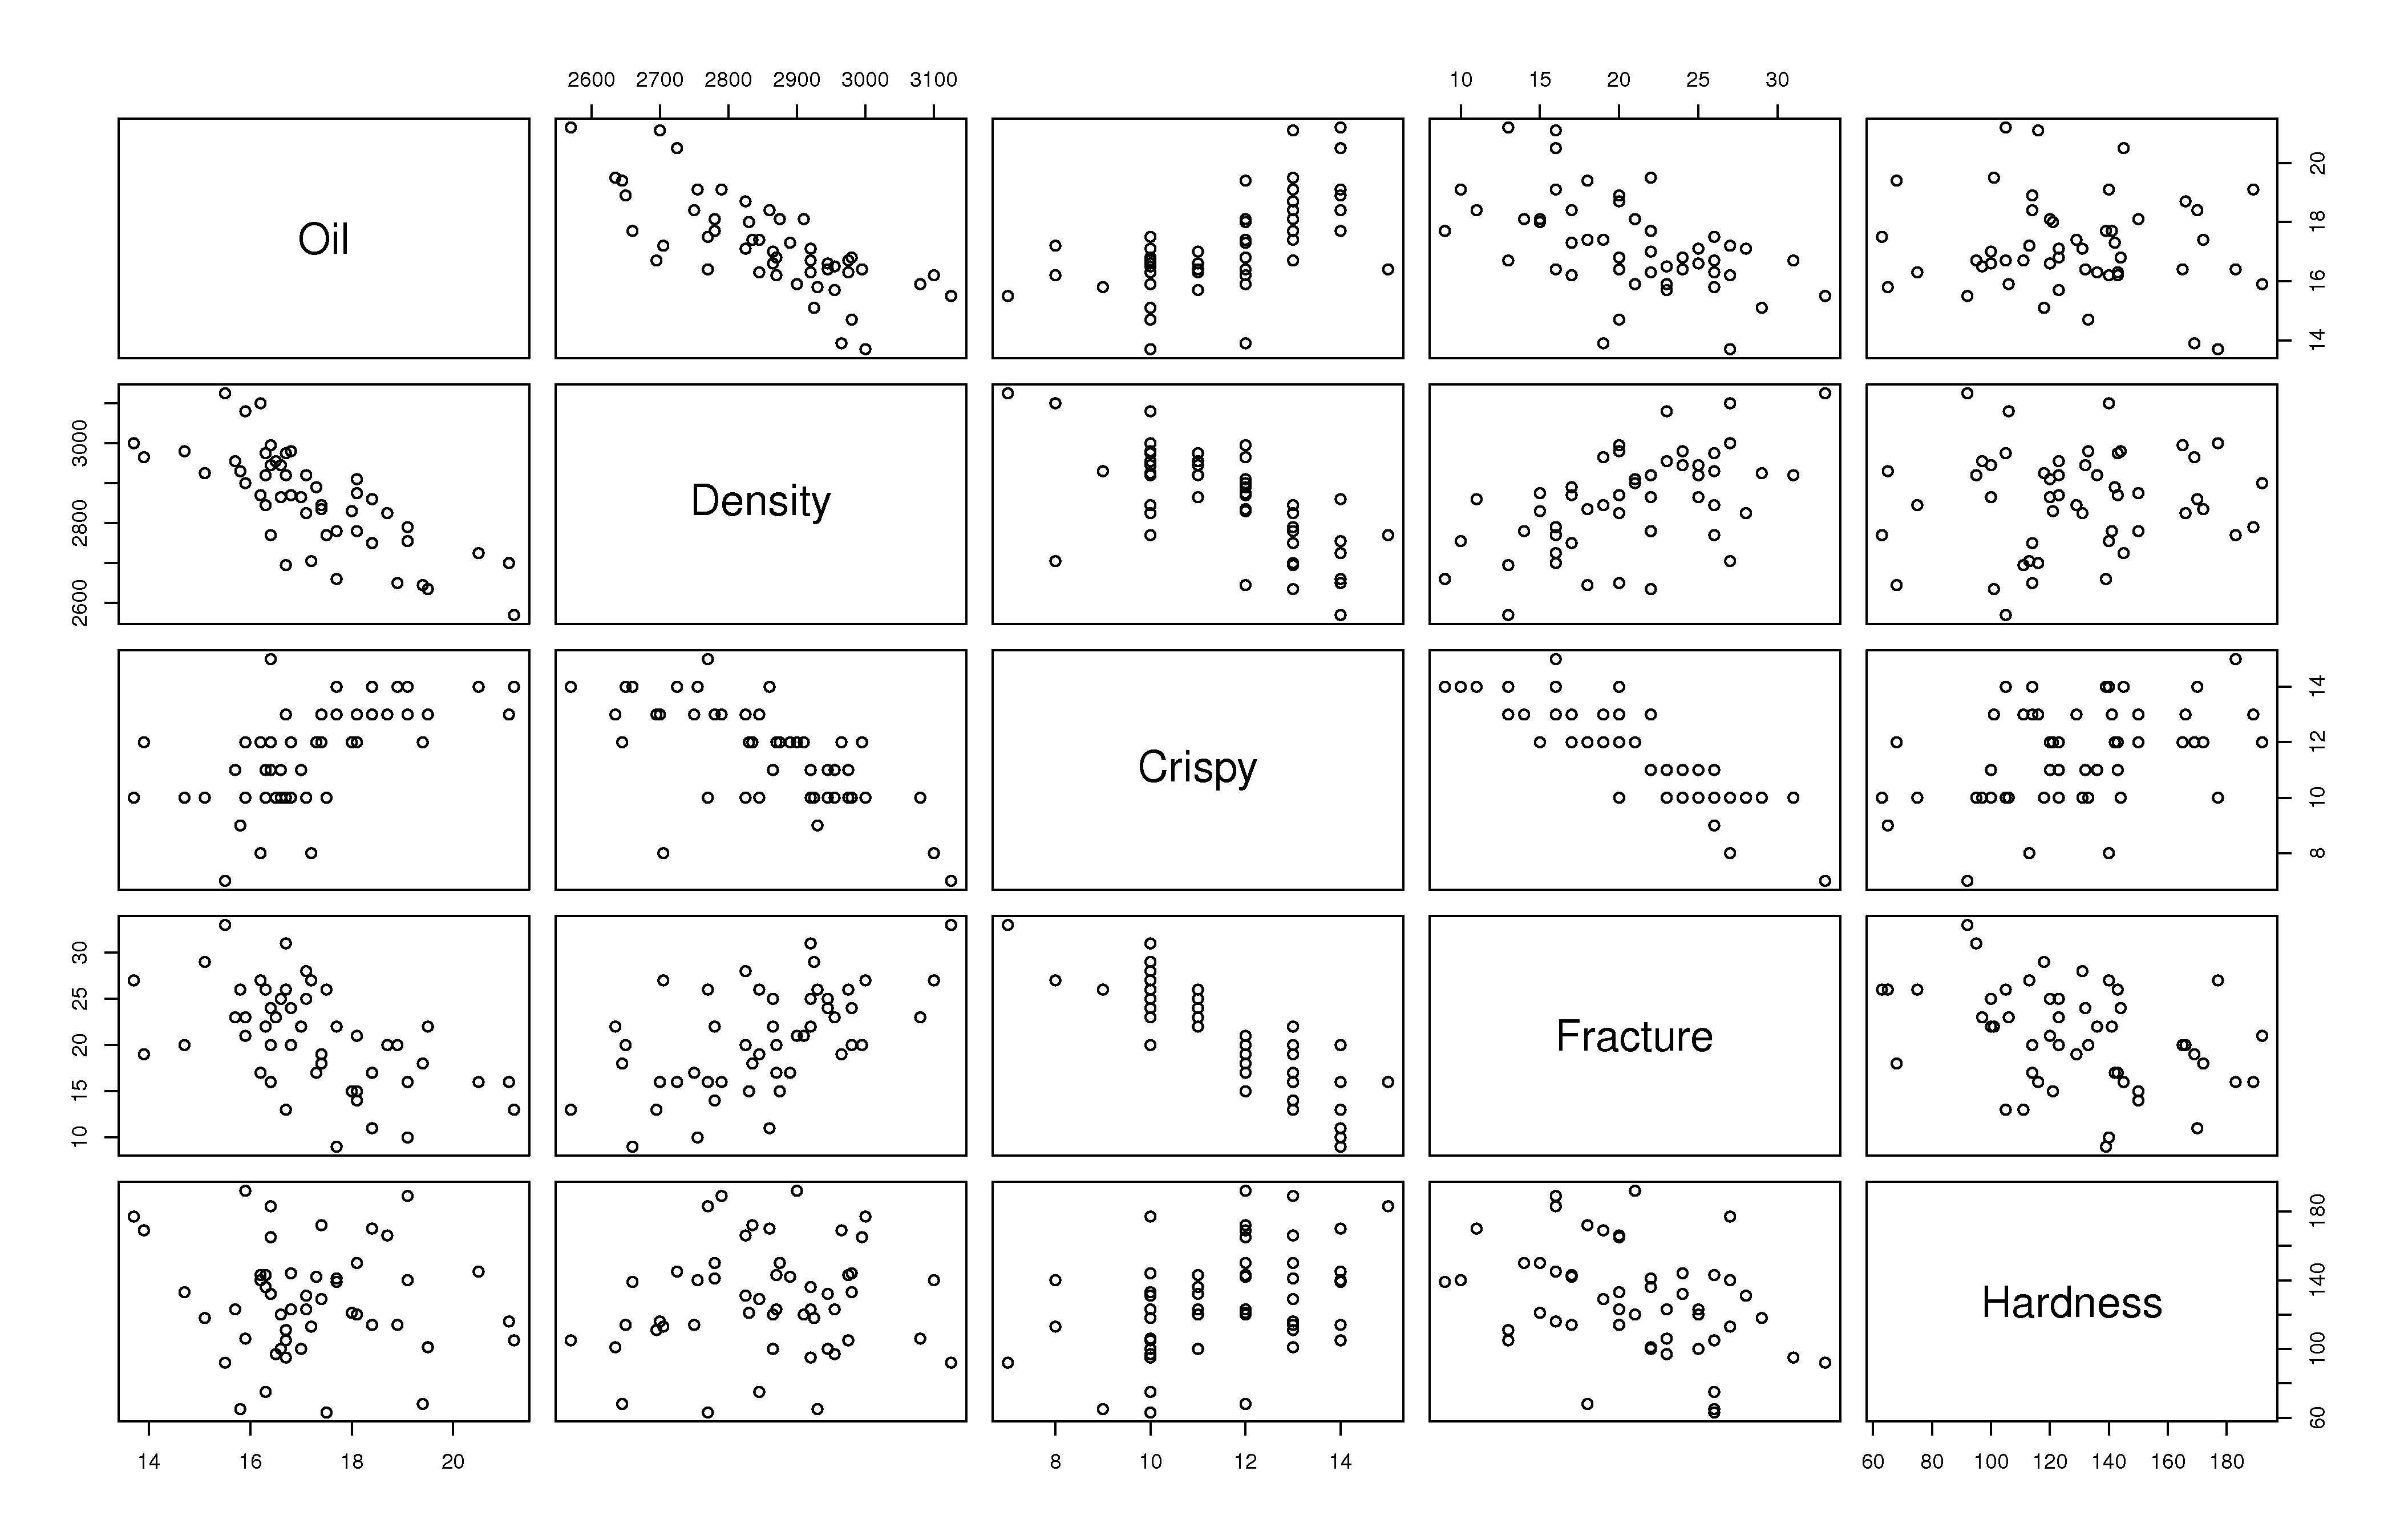
Another effective way to visualize small multivariate data sets is to use a scatterplot matrix. Below is an example for \(K = 5\) measurements on \(N=50\) observations. Scatterplot matrices require \(K(K-1)/2\) plots and can be enhanced with univariate histograms (on the diagonal plots), and linear regressions and loess smoothers on the off-diagonals to indicate the level of correlation between any two variables.