6.5.20. Visualization latent variable models with linking and brushing
Linking is when the same data point(s), are highlighted in two or more plots. This is used to highlight outliers or interesting points in a multivariate data set. The points could be highlighted in terms of colour and/or shape.
Brushing is the same as linking, except it is done in real-time as the user moves a mouse over a plot. This concept was described by Becker and Cleveland in their original article called Brushing Scatterplots, Technometrics, 29, 127-142, 1987.
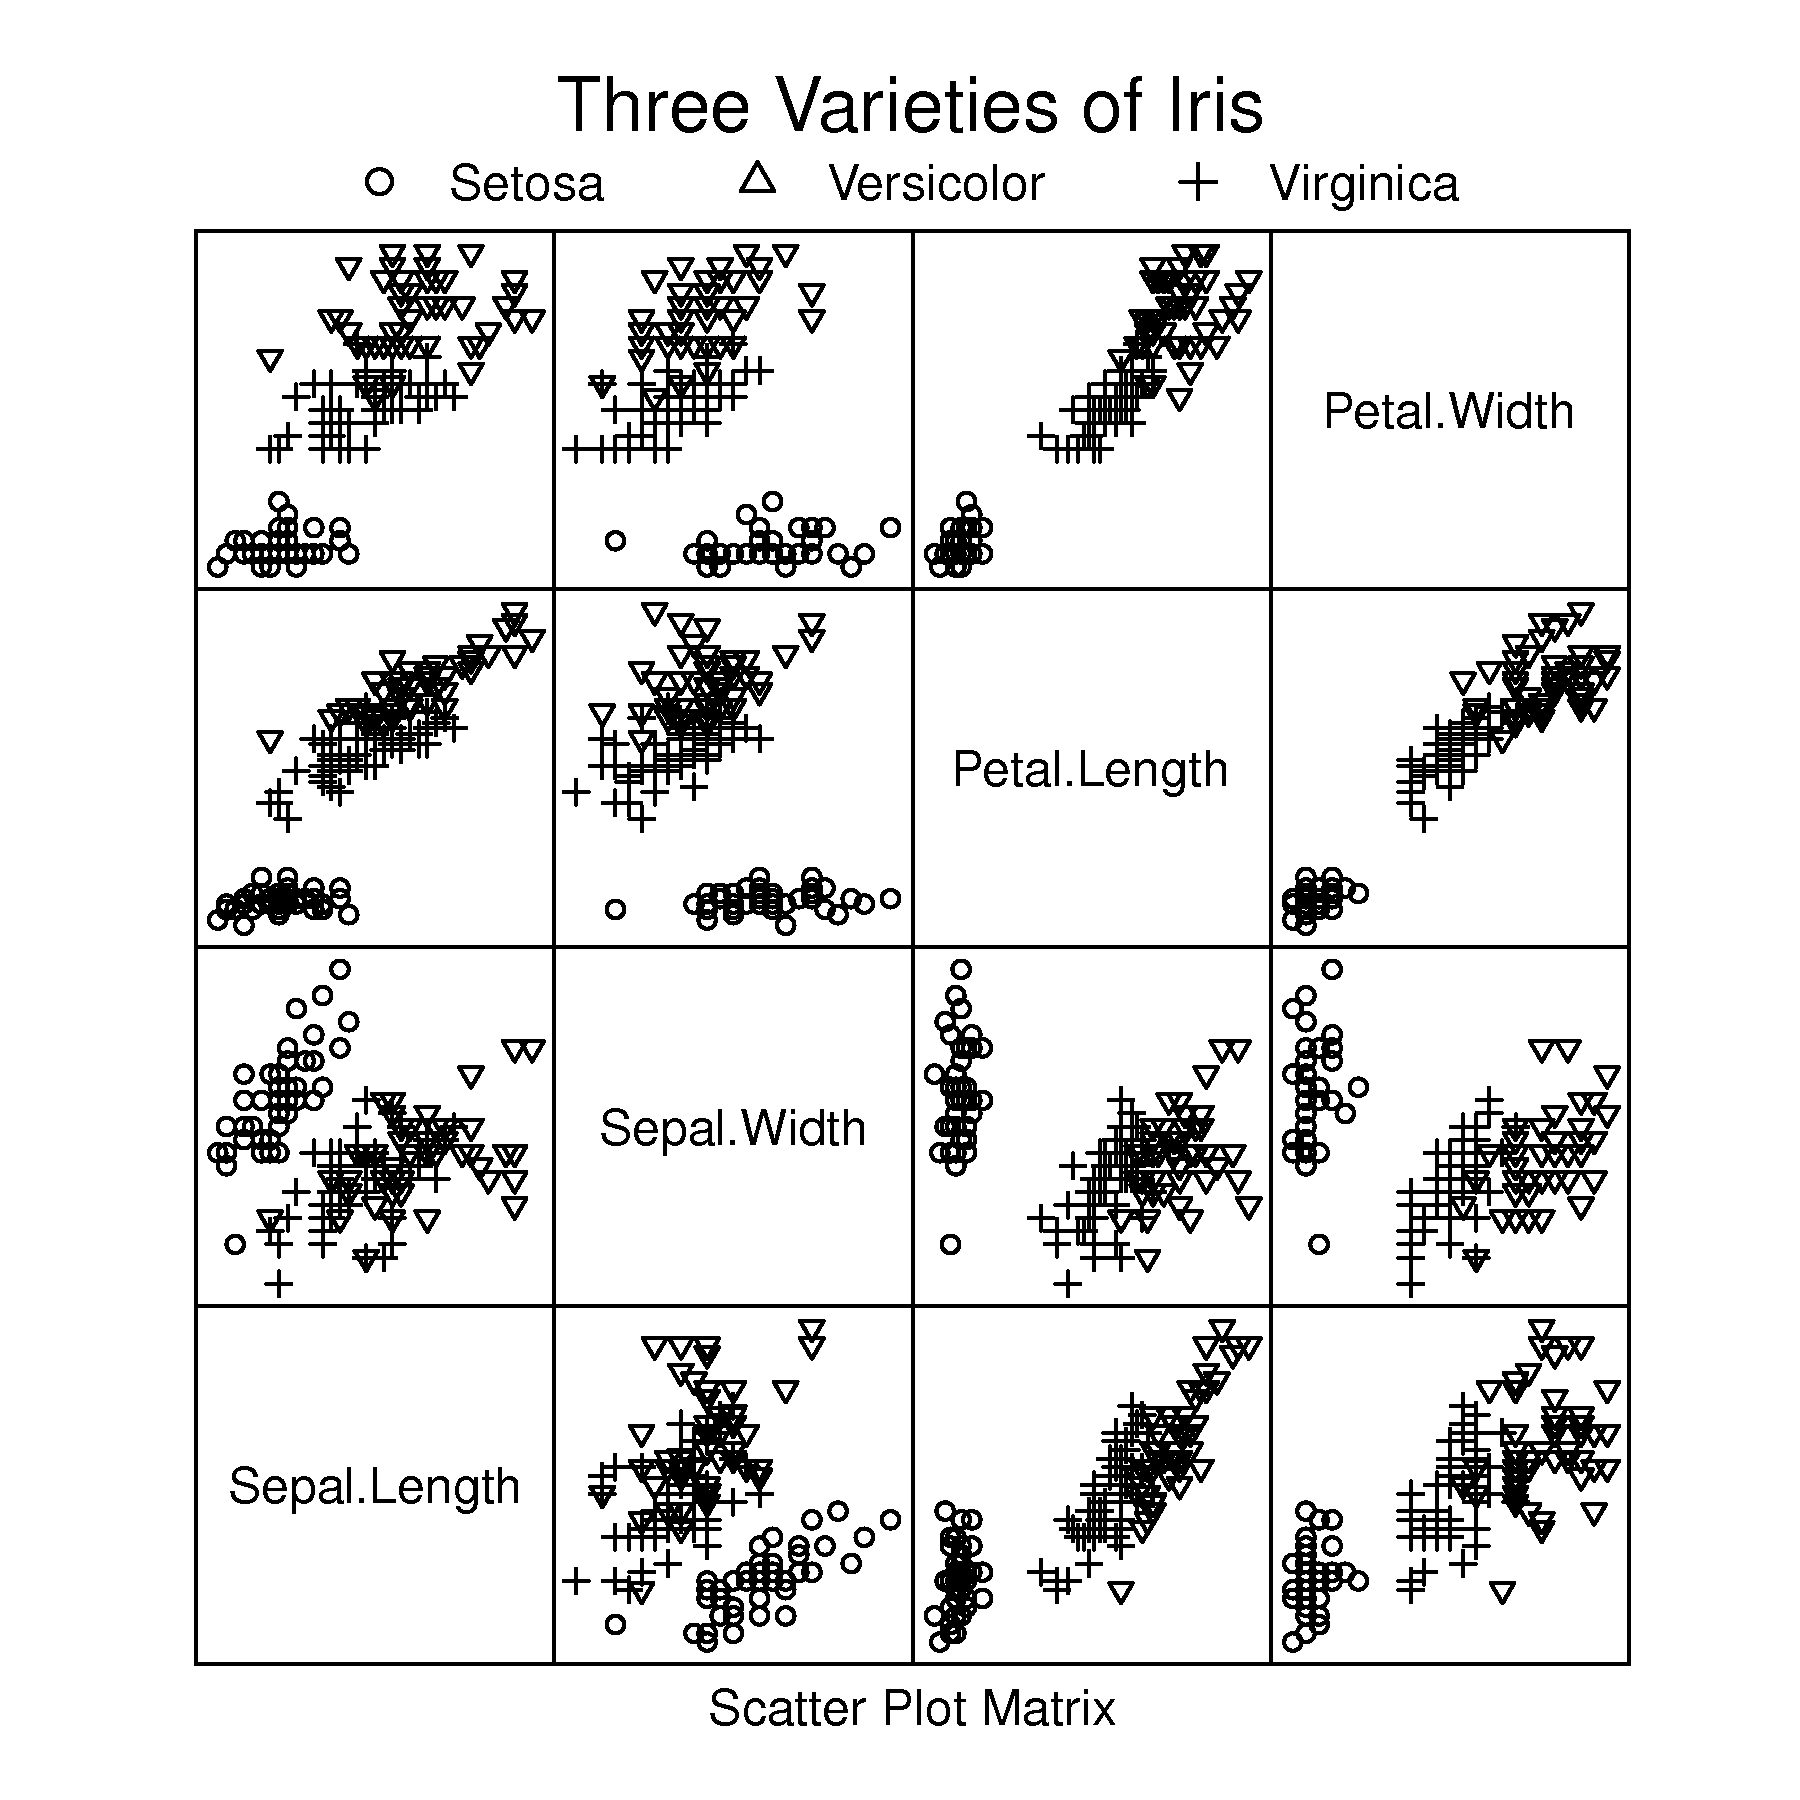
In this illustration we are considering the well-known iris data set, a multivariate data set consisting of the 4 length measurements taken on 3 species of iris. There are 150 observations (50 for each species). Linking is used to mark each iris species with a different marker shape (a different colour could also have been used). Brushing cannot be illustrated, but as shown in the paper by Becker and Cleveland, it would amount to dynamically changing the marker shape or colour of points in one plot, while the user selects those same observations in another plot.
This concept is very powerful to learn from, and to interrogate a latent variable model. For example, when we see interesting observations in the score plot, we can brush through the scores, while having a time series plot of the raw data open alongside. This would highlight what that score feature means in the context of the raw data.