6.4. What is a latent variable?
We will take a look at what a latent variable is conceptually, geometrically, and mathematically.
6.4.1. Your health
Your overall health is a latent variable. But there isn’t a single measurement of “health” that can be measured - it is a rather abstract concept. Instead we measure physical properties from our bodies, such as blood pressure, cholesterol level, weight, various distances (waist, hips, chest), blood sugar, temperature, and a variety of other measurements. These separate measurements can be used by a trained person to judge your health, based on their experience of seeing these values from a variety of healthy and unhealthy patients.
In this example, your health is a latent, or hidden variable. If we had a sensor for health, we could measure and use that variable, but since we don’t, we use other measurements which all contribute in some way to assessing health.
6.4.2. Room temperature
Conceptually
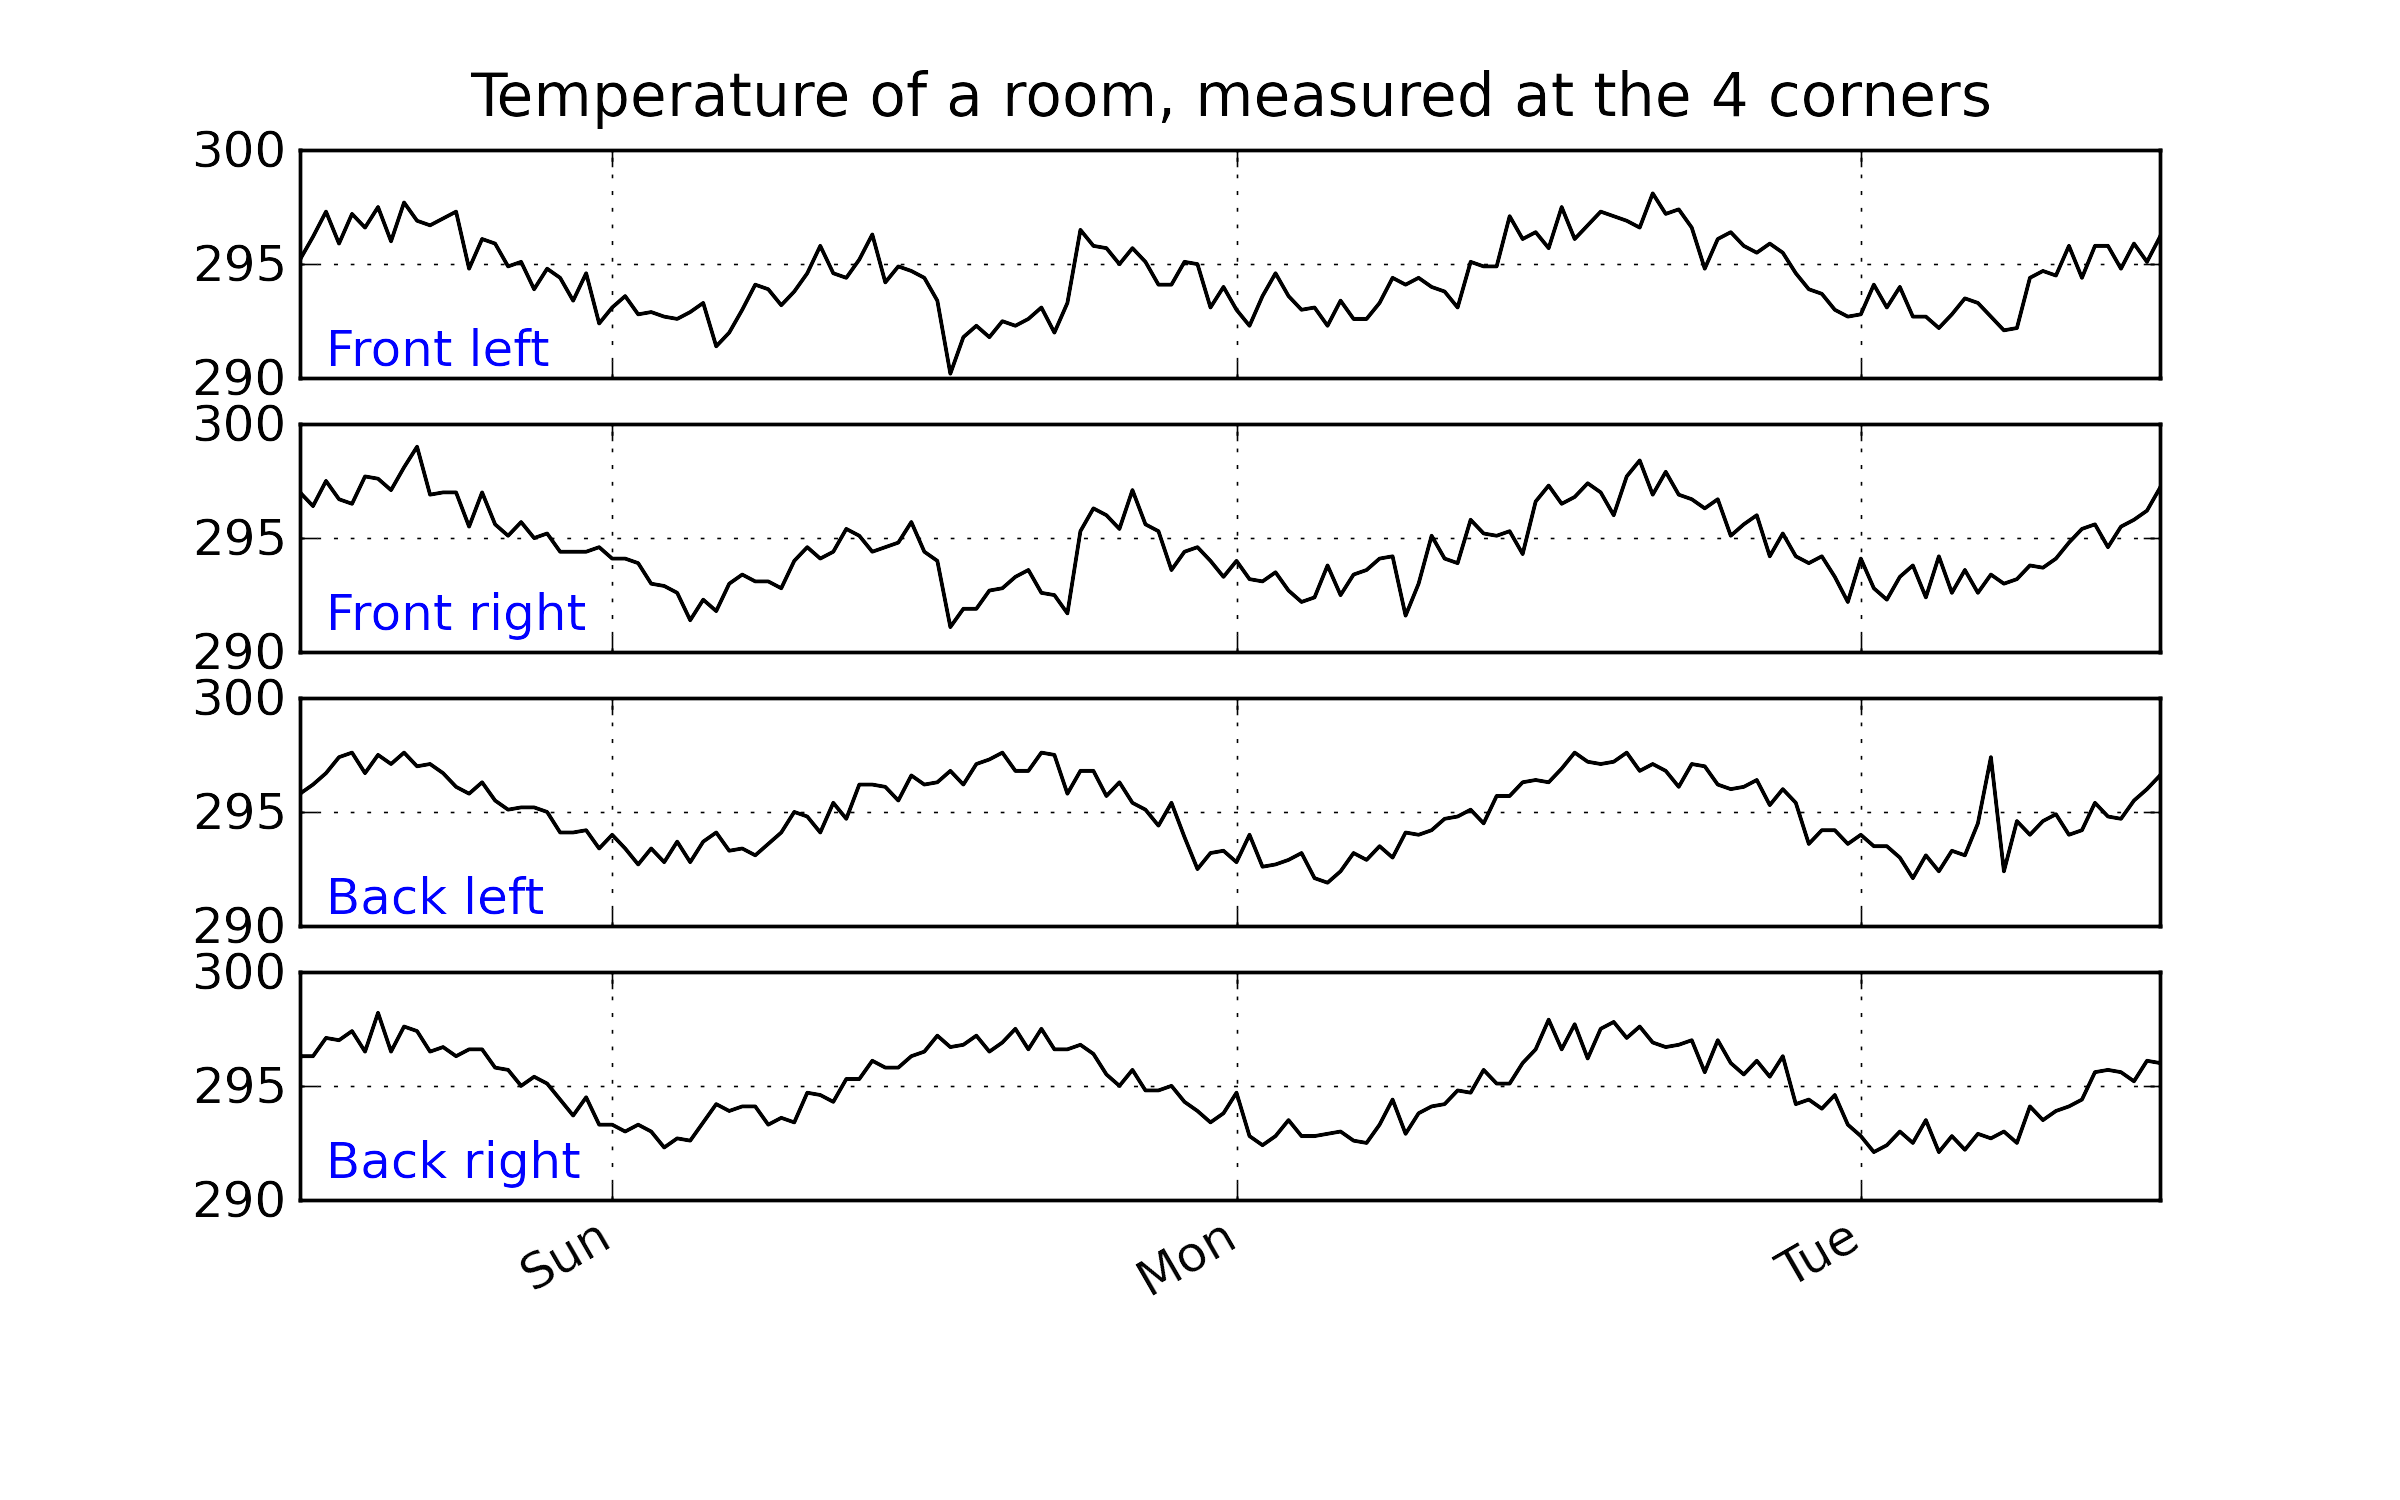
Imagine the room you are in has 4 temperature probes that sample and record the local temperature every 30 minutes. Here is an example of what the four measurements might look like over 3 days.

In table form, the first few measurements are:
Date |
\(x_1\) |
\(x_2\) |
\(x_3\) |
\(x_4\) |
|---|---|---|---|---|
Friday 11:00 |
295.2 |
297.0 |
295.8 |
296.3 |
Friday 11:30 |
296.2 |
296.4 |
296.2 |
296.3 |
Friday 12:00 |
297.3 |
297.5 |
296.7 |
297.1 |
Friday 12:30 |
295.9 |
296.7 |
297.4 |
297.0 |
Friday 13:00 |
297.2 |
296.5 |
297.6 |
297.4 |
Friday 13:30 |
296.6 |
297.7 |
296.7 |
296.5 |
The general up and down fluctuations are due to the daily change in the room’s temperature. The single, physical phenomenon being recorded in these four measurements is just the variation in room temperature.
If we added two more thermometers in the middle of the room, we would expect these new measurements to show the same pattern as the other four. In that regard we can add as many thermometers as we like to the room, but we won’t be recording some new, independent piece of information with each thermometer. There is only one true variable that drives all the temperature readings up and down: it is a latent variable.
Notice that we don’t necessarily have to know what causes the latent variable to move up and down (it could be the amount of sunlight on the building; it could be the air-conditioner’s settings). All we know is that these temperature measurements just reflect the underlying phenomenon that drives the up-and-down movements in temperature; they are correlated with the latent variable.
Notice also the sharp spike recorded at the back-left corner of the room could be due to an error in the temperature sensor. And the front part of the room showed a dip, maybe because the door was left open for an extended period; but not long enough to affect the other temperature readings. These two events go against the general trend of the data, so we expect these periods of time to stand out in some way, so that we can detect them.
Mathematically
If we wanted to summarize the events taking place in the room we might just use the average of the recorded temperatures. Let’s call this new, average variable \(t_1\), which summarizes the other four original temperature measurements \(x_1, x_2, x_3\) and \(x_4\).
and suitable values for each of the weights are \(p_{1,1} = p_{2,1} = p_{3,1} = p_{4,1} = 1/4\).
Mathematically the correct way to say this is that \(t_1\) is a linear combination of the raw measurements (\(x_1, x_2, x_3\) and \(x_4\)) given by the weights (\(p_{1,1}, p_{2,1}, p_{3,1}, p_{4,1}\)).
Geometrically
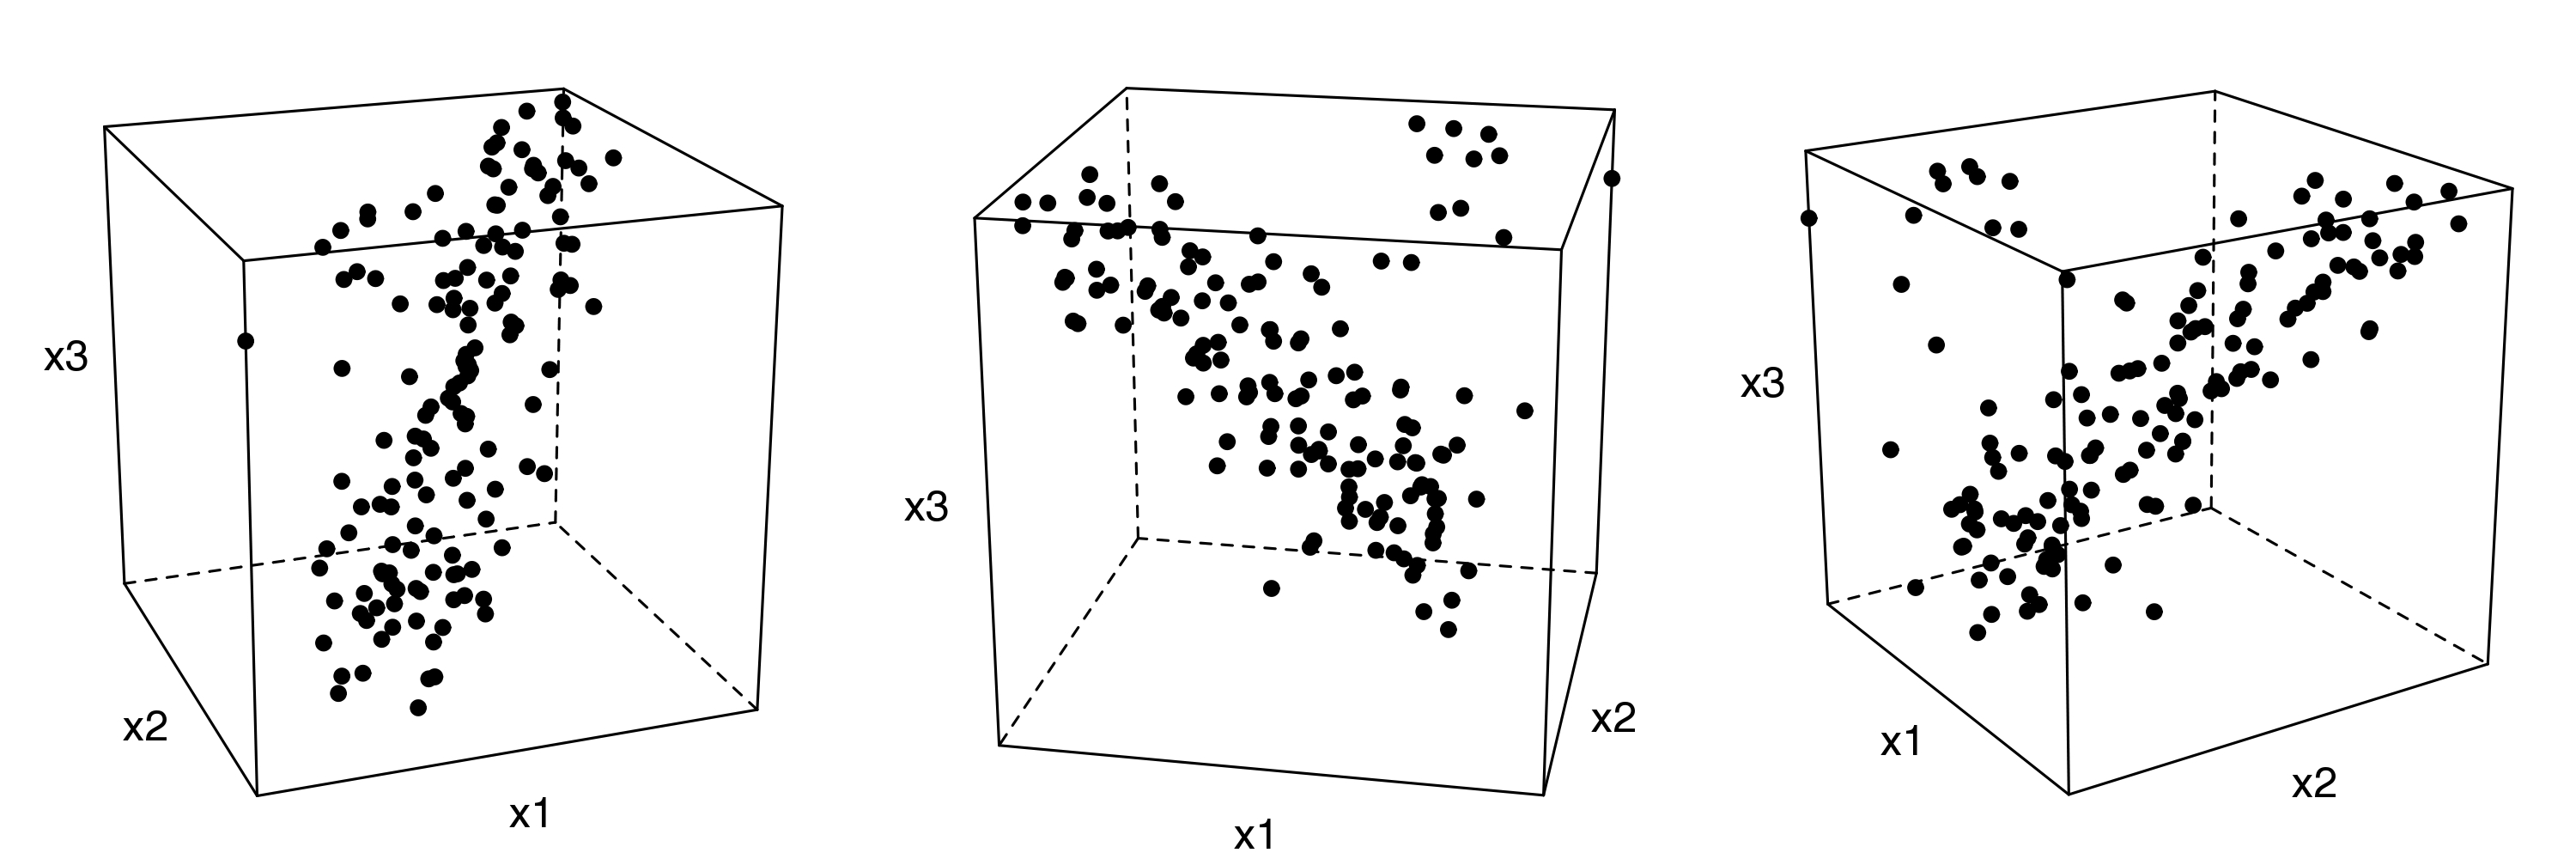
We can visualize the data from this system in several ways, but we will simply show a 3-D representation of the first 3 temperatures: \(x_1, x_2, x_3\).

The 3 plots show the same set of data, just from different points of view. Each observation is a single dot, the location of which is determined by the recorded values of temperature, \(x_1, x_2\) and \(x_3\). We will use this representation in the next section again.
Note how correlated the data appear: forming a diagonal line across the cube’s interior, with a few outliers (described above) that don’t obey this trend.
The main points from this section are:
Latent variables capture, in some way, an underlying phenomenon in the system being investigated.
After calculating the latent variables in a system, we can use these fewer number of variables, instead of the \(K\) columns of raw data. This is because the actual measurements are correlated with the latent variable.
The examples given so far showed what a single latent variables is. In practice we usually obtain several latent variables for a data array. At this stage you likely have more questions, such as “how many latent variables are there in a matrix” and “how are the values in \(\mathbf{P}\) chosen”, and “how do we know these latent variables are a good summary of the original data”?
We address these issues more formally in the next section on principal component analysis.