6.5.18. Latent variable contribution plots
We have previously seen how contribution plots are constructed for a score value, for the SPE and for \(T^2\). We breakdown the value, such as SPE, into its individual terms, one from each variable. Then we plot these \(K\) contribution values as a bar chart.
There are \(K\) contribution terms for a score: \(t_{i,a} = \mathbf{x}_{i} \mathbf{p}_a\):
The contribution to \(T^2\) is similar to a score contribution, except we calculate the weighted summation over all the scores, \(t_{i,a}\), where the weights are the variances of the \(a^\text{th}\) score.
For SPE = \(\sqrt{\mathbf{e}'_{i}\mathbf{e}_{i}}\), where \(\mathbf{e}'_{i} = \mathbf{x}'_i - \widehat{\mathbf{x}}'_{i}\), the bars in the contribution plots are:
The SPE contributions are usually shown as the square of the values in brackets, accounting for the sign, as in \(e_{i,k} = (x_{i,k} - \hat{x}_{i,k})\), and then plot each bar: \(\text{sign}(e_{i,k}) \times e^2_{i,k}\). The squared values are more realistic indicators of the contributions, while the sign information might be informative in some cases.
The other point to mention here is that contributions are calculated from one point to another point. Most often, the from point is the model center or the model plane. So for SPE, the contributions are from the model plane to the \(i^\text{th}\) observation off the model plane. The score contributions are from the model center to the observation’s projection on the (hyper)plane.
But sometimes we would like to know, as in the figure below, what are the contribution from one point to another. And these start and end points need not be an actual point; for a group of points we can use a suitable average of the points in the cluster. So there are point-to-point, point-to-group, group-to-point, and group-to-group contributions in the scores.
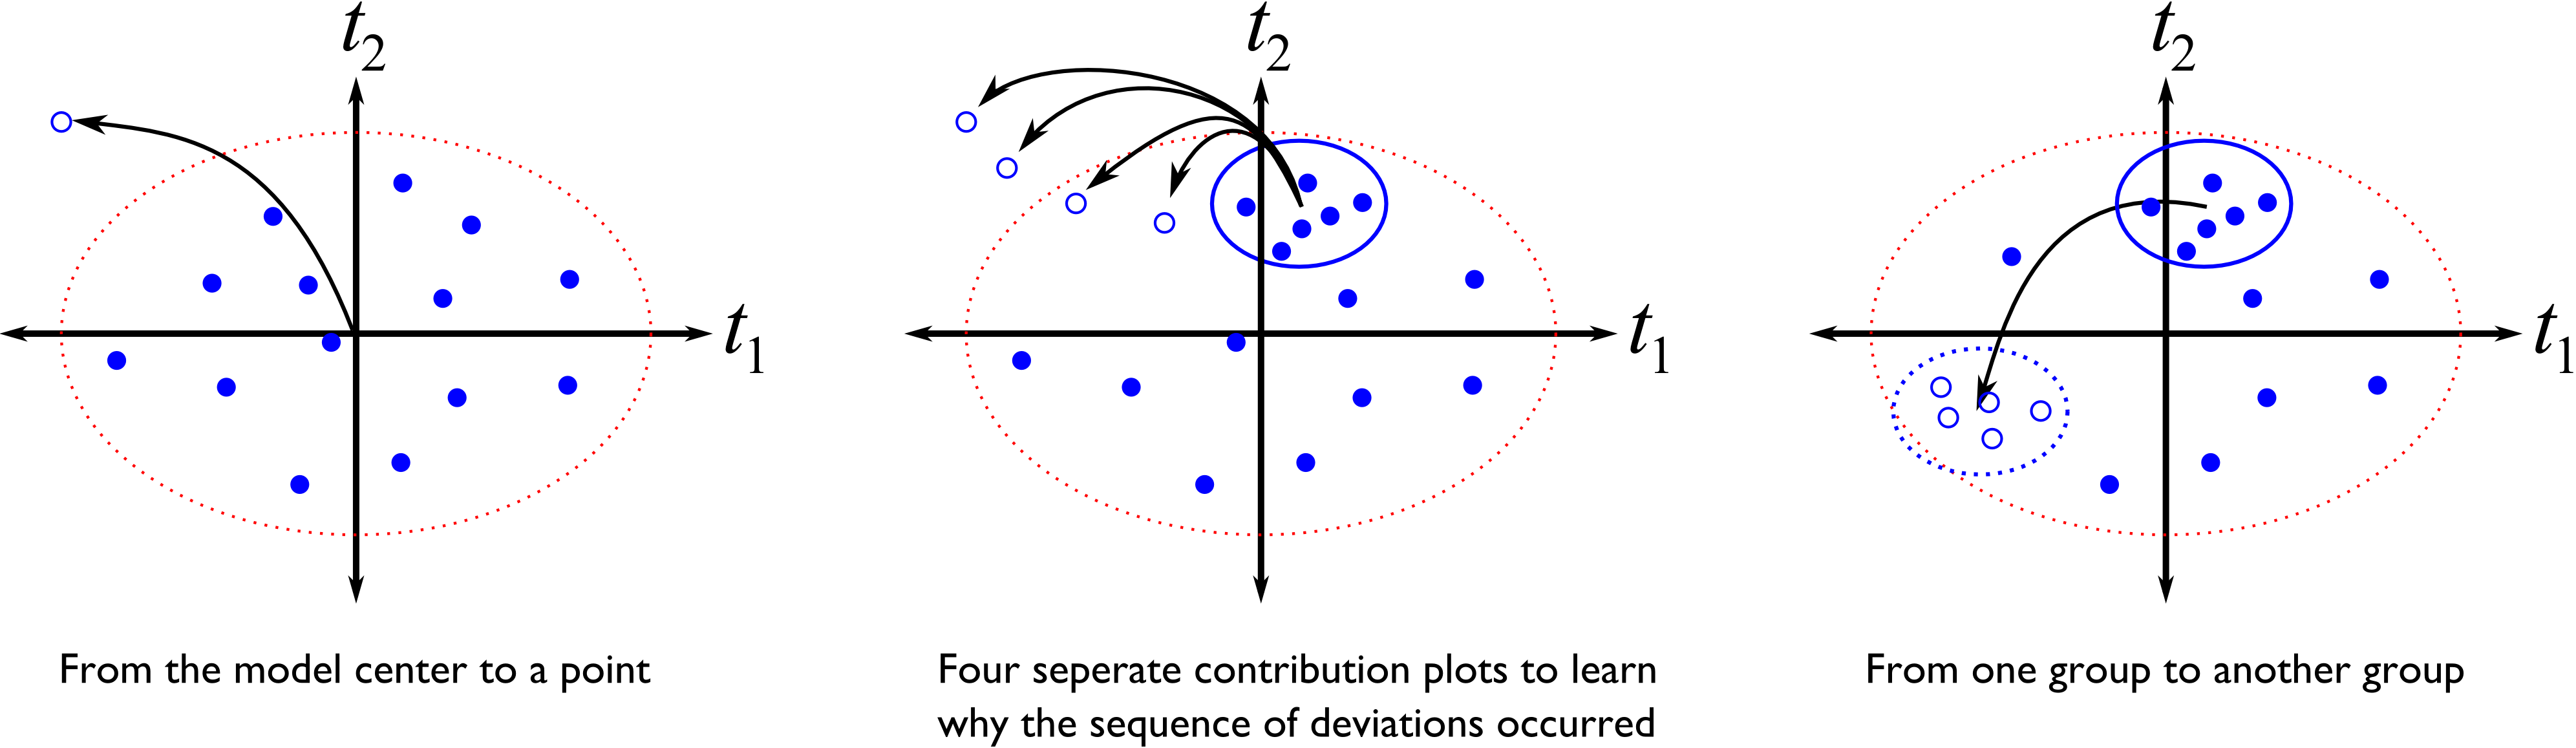
The calculation procedure is actually the same in all cases: for a group of points, collapse it down to the center point in the group, then calculate the point-to-point contribution. If the starting point is not specified, then the contribution will be from the model center, i.e. \((t_i, t_j) = (0, 0)\) to the point.