1.7. Tables as a form of data visualization
A data table, or a spreadsheet, is an efficient format for comparative data analysis on categorical objects. Usually, the items being compared are placed in a column, while the categorical objects are in the rows. The quantitative value is then placed at the intersection of the row and column, called the cell. The following examples demonstrate data tables.
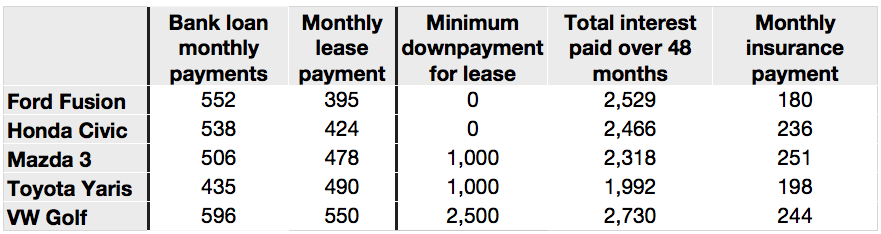
This table compares monthly payments for buying or leasing various cars (categories). The first two columns are being compared; the other columns contain additional, secondary information.
The next table compares defect types (number of defects) for different product grades (categories).
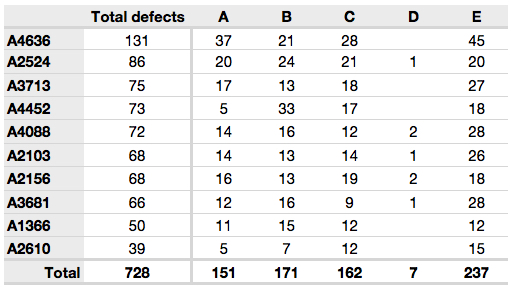
This particular table raises more questions:
Which defects cost us the most money?
Which defects occur most frequently? The table does not contain any information about production rate. For example, if there were 1850 lots of grade A4636 (first row) produced, then defect A occurs at a rate of 37/1850 = 1/50. And if 250 lots of grade A2610 (last row) were produced, then, again, defect A occurs at a rate of 1/50. Redrawing the table on a production-rate basis would be useful if we are making changes to the process and want to target the most problematic defect.
If we are comparing a type of defect over different grades, then we are now comparing down the table, instead of across the table. In this case, the fraction of defects for each grade would be a more useful quantity to display.
If we are comparing defects within a grade, then we are comparing across the table. Here again, the fraction of each defect type, weighted according to the cost of that defect, would be more appropriate.
Three common pitfalls to avoid:
Avoid using pie charts when tables will do.
Pie charts are tempting when we want to graphically break down a quantity into components. I have used them erroneously myself (here is an example on a website that I helped with: http://www.macc.mcmaster.ca/gradstudies.php). We won’t go into details here, but I strongly suggest you read the convincing evidence of Stephen Few in: “Save the pies for dessert”. The key problem is that the human eye cannot adequately decode angles; however, we have no problem with linear data.
Avoid arbitrary ordering along the first column; usually, alphabetically or in time order is better.
Listing the car types alphabetically is trivial: instead, list them by some other third criterion of interest, perhaps minimum down payment required, typical lease duration, or total amount of interest paid on the loan. That way you get some extra context to the table for free.
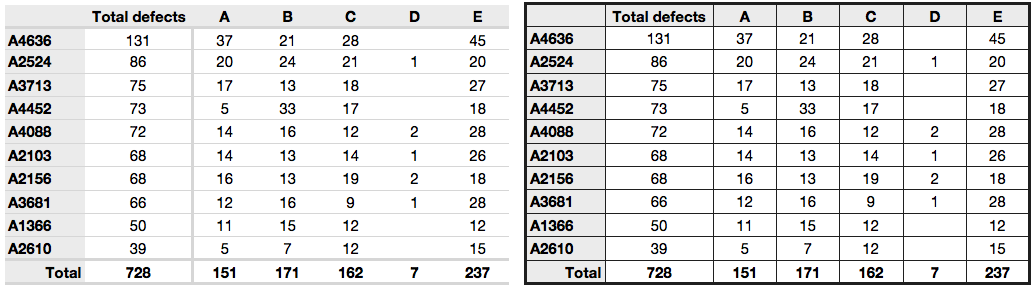
Avoid using excessive grid lines.
Tabular data should avoid vertical grid lines, except when the columns are so close that mistakes will be made. The human eye will use the visual white space between the numbers to create its own columns.
To wrap up this section is a demonstration of tabular data in a different format, based on an idea of Tufte in The Visual Display of Quantitative Information, p. 158. Here we compare the corrosion resistance and roughness of a steel surface for two different types of coatings, A and B.
A layout that you expect to see in a standard engineering report:
Product
Corrosion resistance
Surface roughness
Coating A
Coating B
Coating A
Coating B
K135
0.30
0.22
30
42
K136
0.45
0.39
86
31
P271
0.22
0.24
24
73
P275
0.40
0.44
74
52
S561
0.56
0.36
70
75
S567
0.76
0.51
63
70
And the layout advocated by Tufte:
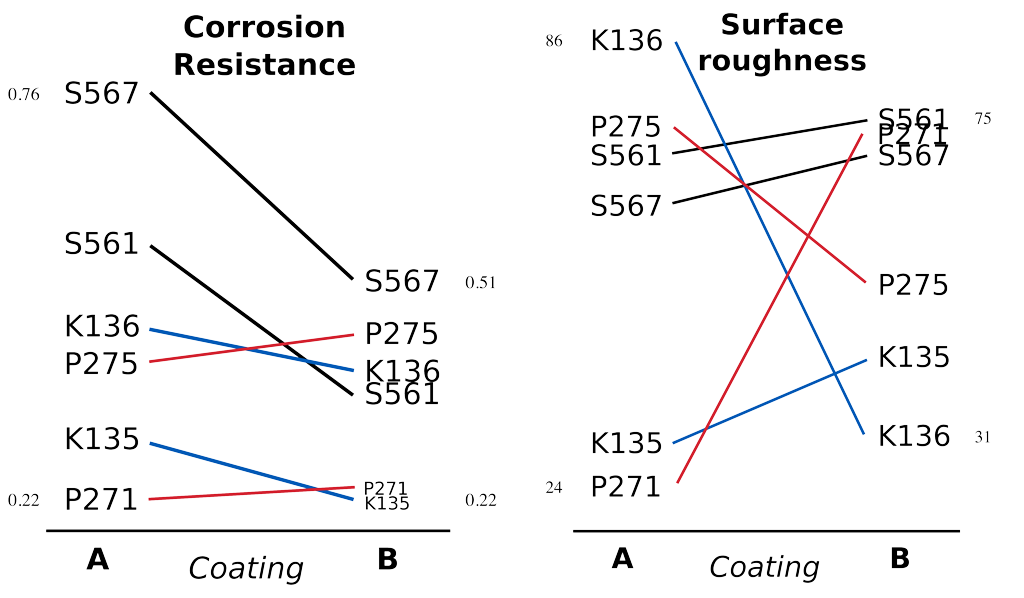
Note how the slopes carry the information about the effect of changing the coating type. The rearranged row ordering shows these changes as well. This idea is effective for two treatments but could be extended to three or four treatments by adding extra “columns”. Only the extremes are numbered, but every point could be numbered if the values are also required by the readers.