
 Download PDF of entire book
Process Improvement Using Data
This book is free to read here, or to download as a PDF. It covers the methods engineers and scientists use with process data: visualization, univariate statistics, process monitoring, least squares models, designed experiments, and latent variable models such as PCA and PLS.
The Python examples in chapters 1 to 6 each have a Run in browser button, as under the raincloud plot in box plots. A click starts Python in your browser tab, runs the example on its data set and draws the result under the code, with nothing to install. The examples use process-improve, the book’s open-source Python package.
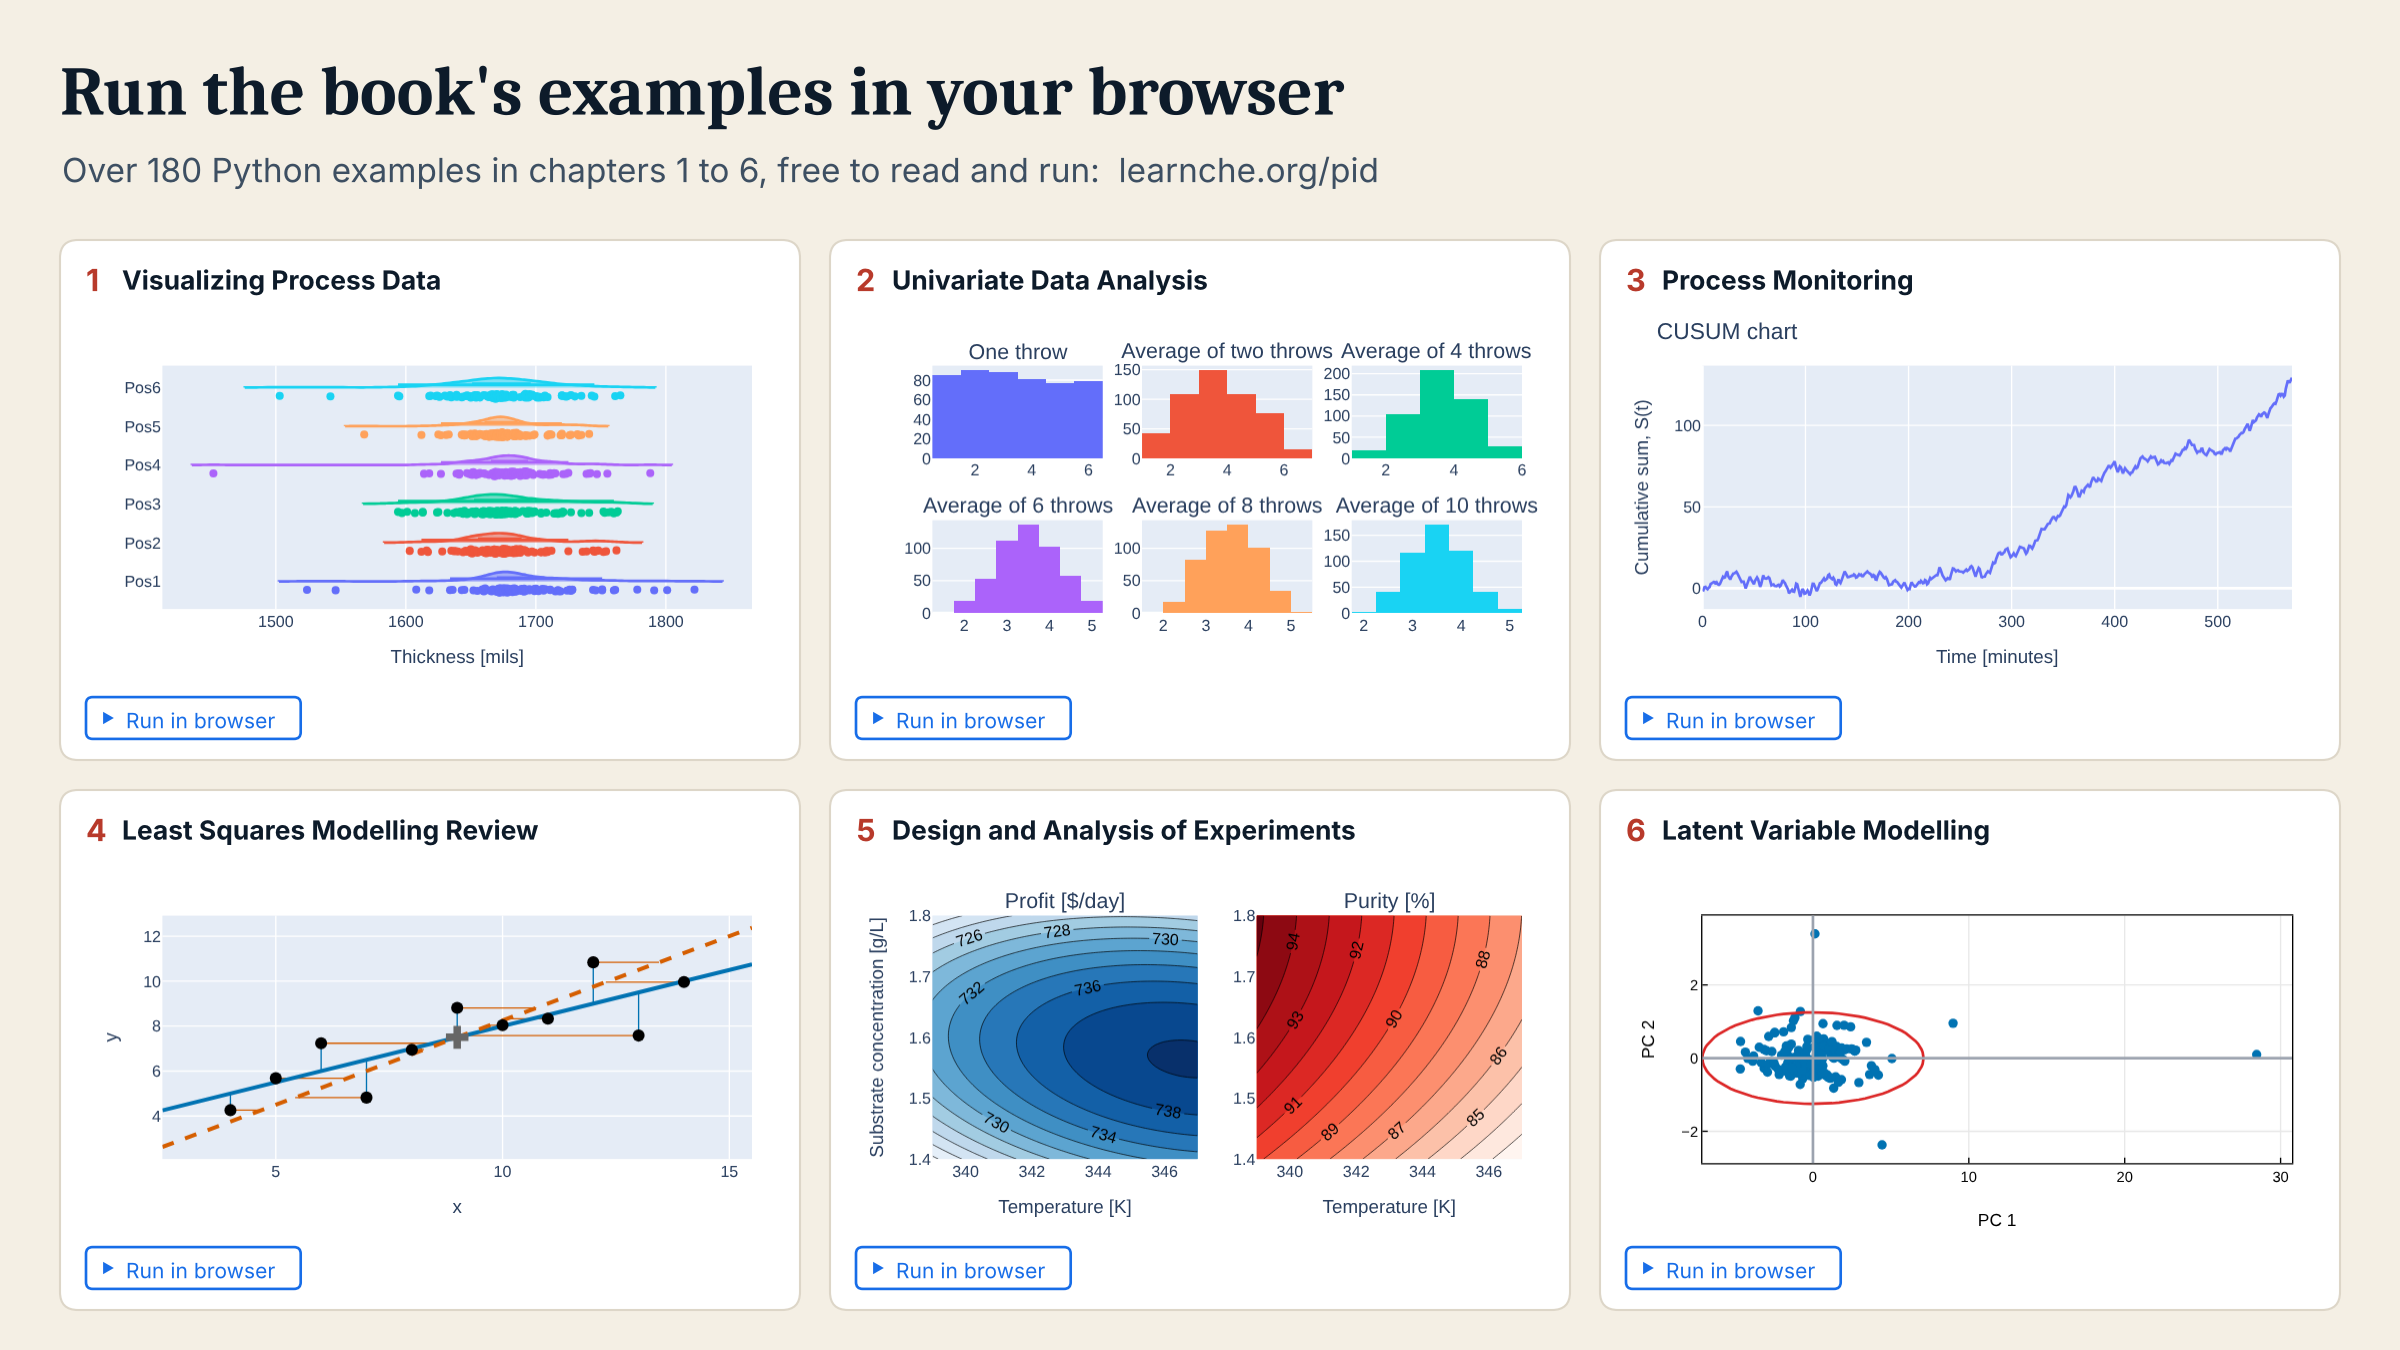
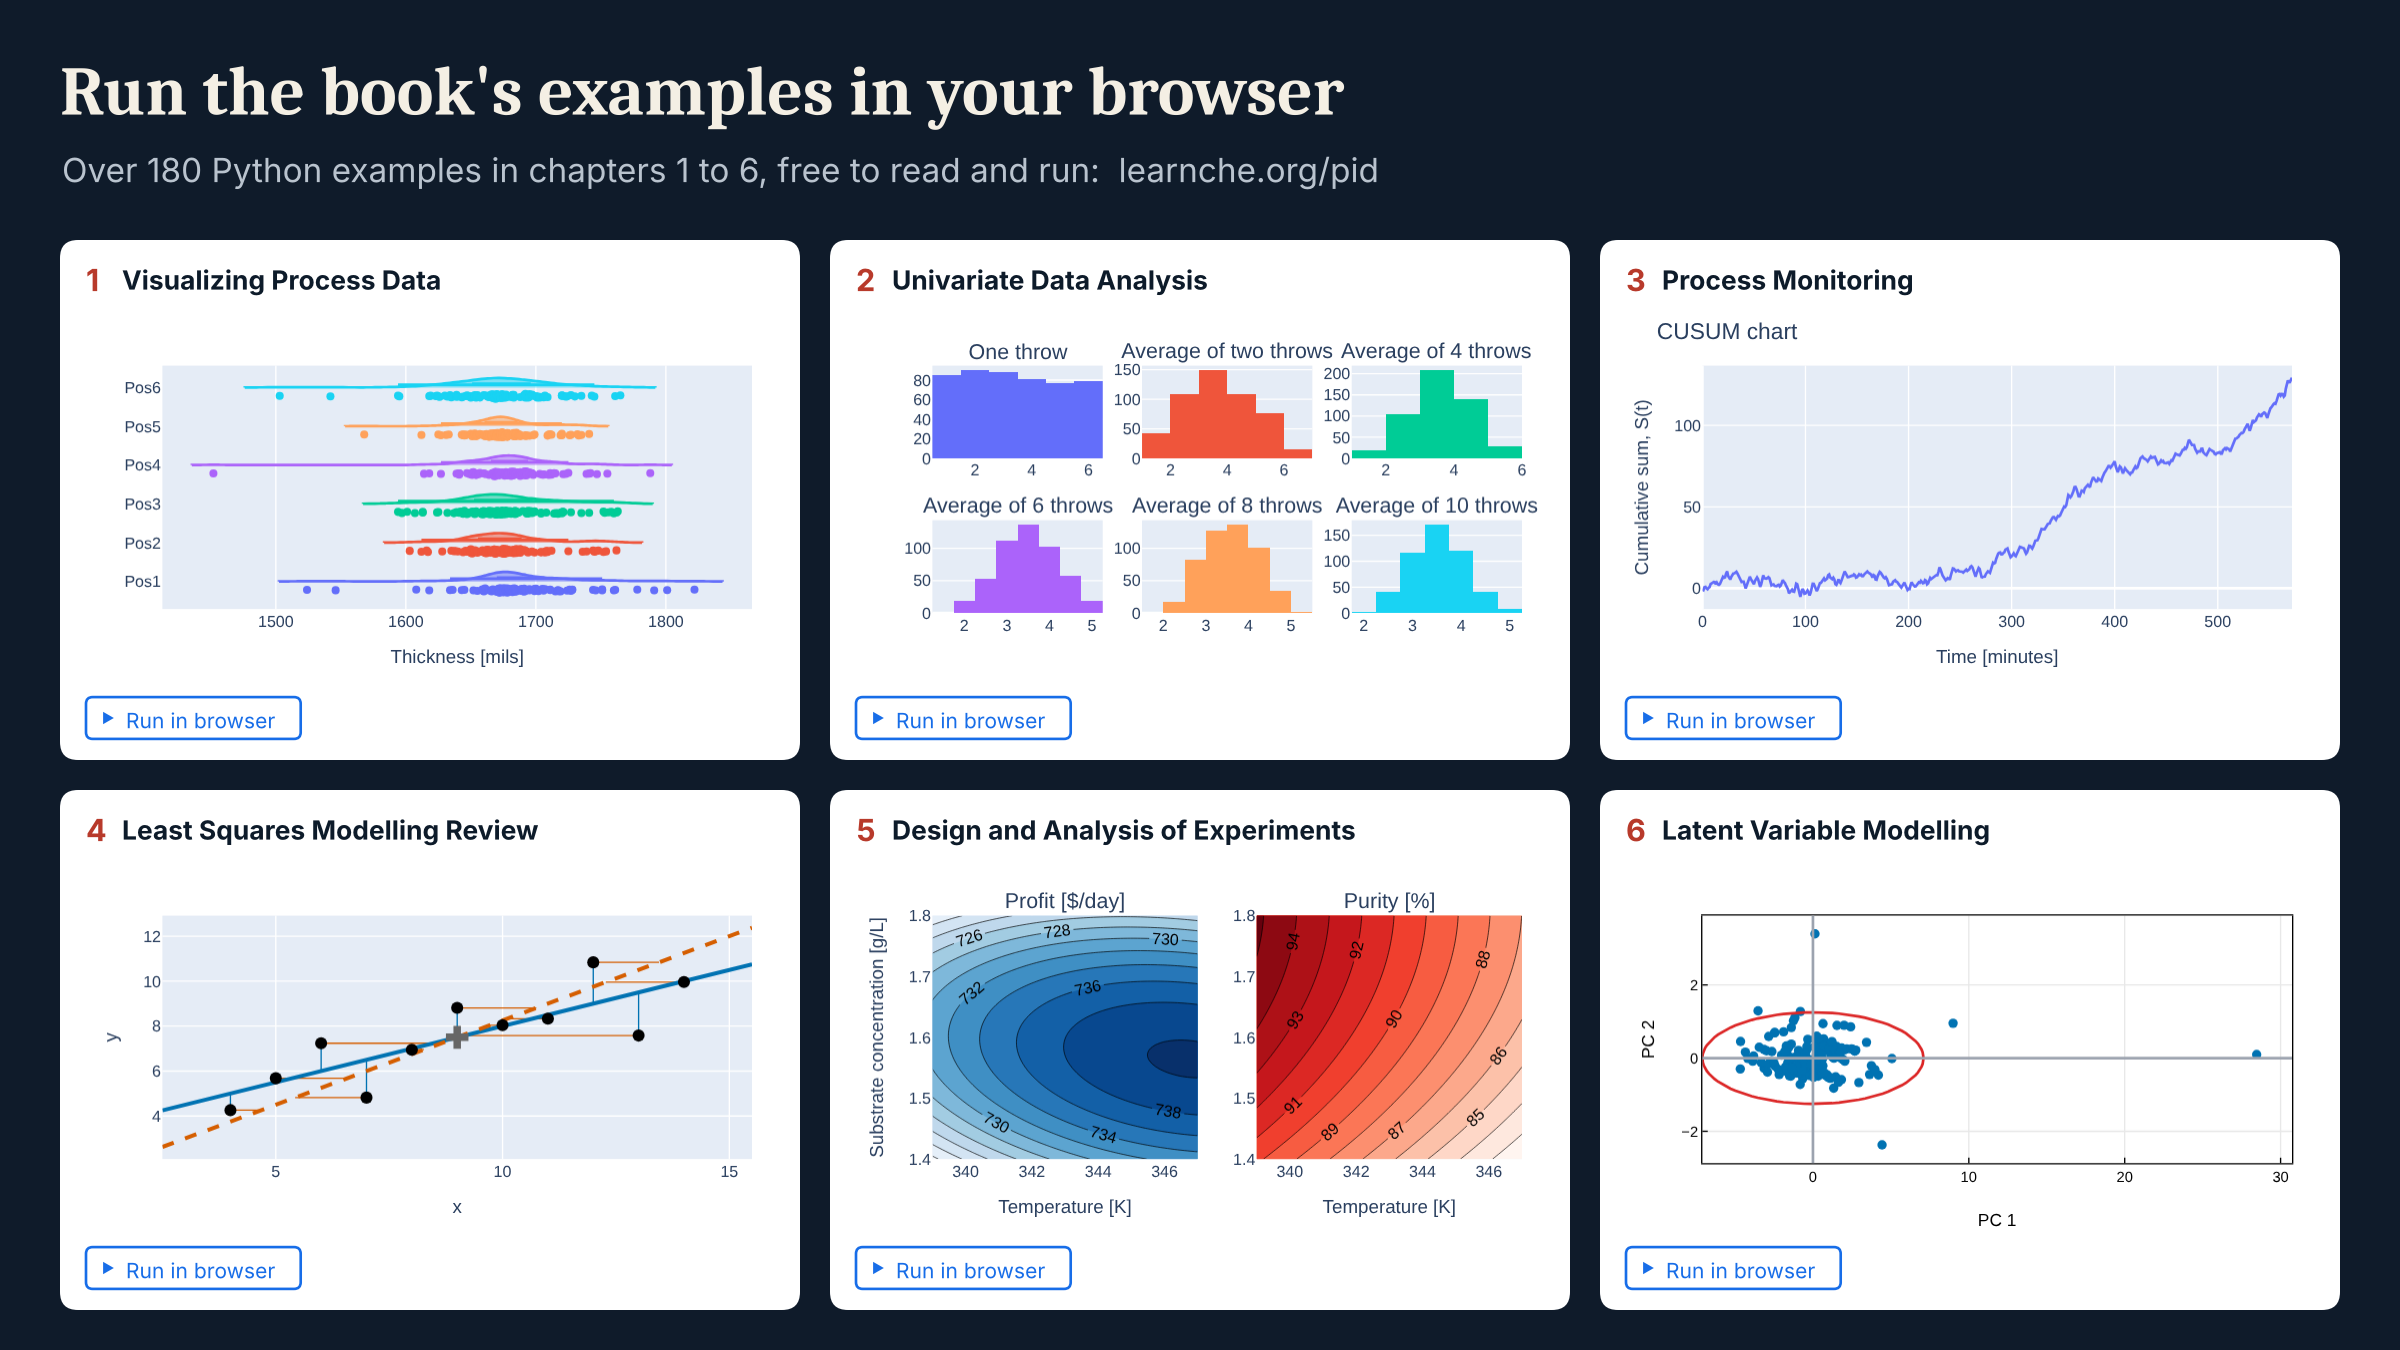
Table of Contents
- 1. Visualizing Process Data
- 1.1. Data visualization in context
- 1.2. References and readings
- 1.3. Time-series plots
- 1.4. Bar plots
- 1.5. Box plots
- 1.6. Relational graphs: scatter plots
- 1.7. Tables as a form of data visualization
- 1.8. Topics of aesthetics and style
- 1.9. General summary: revealing complex data graphically
- 1.10. Exercises
- 2. Univariate Data Analysis
- 2.1. Univariate data analysis in context
- 2.2. References and readings
- 2.3. What is variability?
- 2.4. Histograms and probability distributions
- 2.5. Some terminology
- 2.6. Binary (Bernoulli) distribution
- 2.7. Uniform distribution
- 2.8. The normal distribution and checking for normality
- 2.9. The t-distribution
- 2.10. Poisson distribution
- 2.11. Confidence intervals
- 2.12. Testing for differences and similarity
- 2.13. Paired tests
- 2.14. Other types of confidence intervals
- 2.15. Statistical tables for the normal- and t-distribution
- 2.16. Exercises
- 3. Process Monitoring
- 3.1. Process monitoring in context
- 3.2. References and readings
- 3.3. What are process monitoring charts?
- 3.4. Shewhart charts
- 3.5. CUSUM charts
- 3.6. EWMA charts
- 3.7. Other types of monitoring charts
- 3.8. Process capability
- 3.9. The industrial practice of process monitoring
- 3.10. Industrial case study
- 3.11. Summary
- 3.12. Exercises
- 4. Least Squares Modelling Review
- 4.1. Least squares modelling in context
- 4.2. References and readings
- 4.3. Covariance
- 4.4. Correlation
- 4.5. Some definitions
- 4.6. Least squares models with a single x-variable
- 4.7. Least squares model analysis
- 4.8. Investigating an existing linear model
- 4.9. Summary of steps to build and investigate a linear model
- 4.10. More than one variable: multiple linear regression (MLR)
- 4.11. Outliers: discrepancy, leverage, and influence of the observations
- 4.12. Enrichment topics
- 4.13. Exercises
- 5. Design and Analysis of Experiments
- 5.1. Design and analysis of experiments in context
- 5.2. Terminology
- 5.3. Usage examples
- 5.4. References and readings
- 5.5. Why learning about systems is important
- 5.6. Experiments with a single variable at two levels
- 5.7. Changing one single variable at a time (COST)
- 5.8. Full factorial designs
- 5.9. Fractional factorial designs
- 5.10. Blocking and confounding for disturbances
- 5.11. Response surface methods
- 5.12. Evolutionary operation
- 5.13. Multi-response optimization: the sweet spot and desirability
- 5.14. Optimal designs of experiments: D-, A-, and G-optimality and the information matrix
- 5.15. Definitive screening designs (DSD): screen factors and detect curvature in one experiment
- 5.16. OMARS designs: orthogonal minimally aliased response surface designs
- 5.17. A worked OMARS study: four factors on a fed-batch bioreactor
- 5.18. Judging and comparing experimental designs
- 5.19. An omnibus comparison across design families
- 5.20. A worked screen-then-optimise study: six factors on a reactor with a heat limit
- 5.21. Mixture experiments
- 5.22. General approach for experimentation
- 5.23. Extended topics related to designed experiments
- 5.24. Exercises
- 6. Latent Variable Modelling
- 7. Applications of Process Improvement using Data
- 7.1. Improved process understanding
- 7.2. Troubleshooting process problems
- 7.3. Multivariate process monitoring case studies
- 7.4. Soft sensors and inferential sensors
- 7.5. Keeping a model current: an adaptive soft sensor
- 7.6. Multivariate image analysis
- 7.7. Batch process monitoring and improvement
- 7.8. Learning from batch trajectories: the DuPont polymerization reactor
- 7.9. Diagnosing a known fault with batch PLS: the SBR reactor
- 7.10. Combining initial conditions and trajectories: multiblock batch PLS on a batch dryer
- 7.11. Product development and product improvement
- 7.12. A mixed-level split-plot design with a profile response