
 Download PDF of entire book
7.6. Multivariate image analysis
This section just gives a impression how 3-D and higher dimensional data sets are dealt with. Tools such as PCA and PLS work on two-dimensional matrices. When we receive a 3-dimensional array, such as an image, or a batch data set, then we must unfold that array into a (2D) matrix if we want to use PCA and PLS in the usual manner.
The following illustration shows how we deal with an image, such as the one taken from a colour camera. Imagine we have \(I\) rows and \(J\) columns of pixels, on 3 layers (red, green and blue wavelengths). Each entry in this array is an intensity value, a number between 0 and 255. For example, a pure red pixel is has the following 3 intensity values in layer 1, 2 and 3: (255, 0, 0), because layer 1 contains the intensity of the red wavelengths. A pure blue pixel would be (0, 0, 255), while a pure green pixel would be (0, 255, 0) and a pure white pixel is (255, 255, 255). In other words, each pixel is represented as a triplet of 3 intensity values.
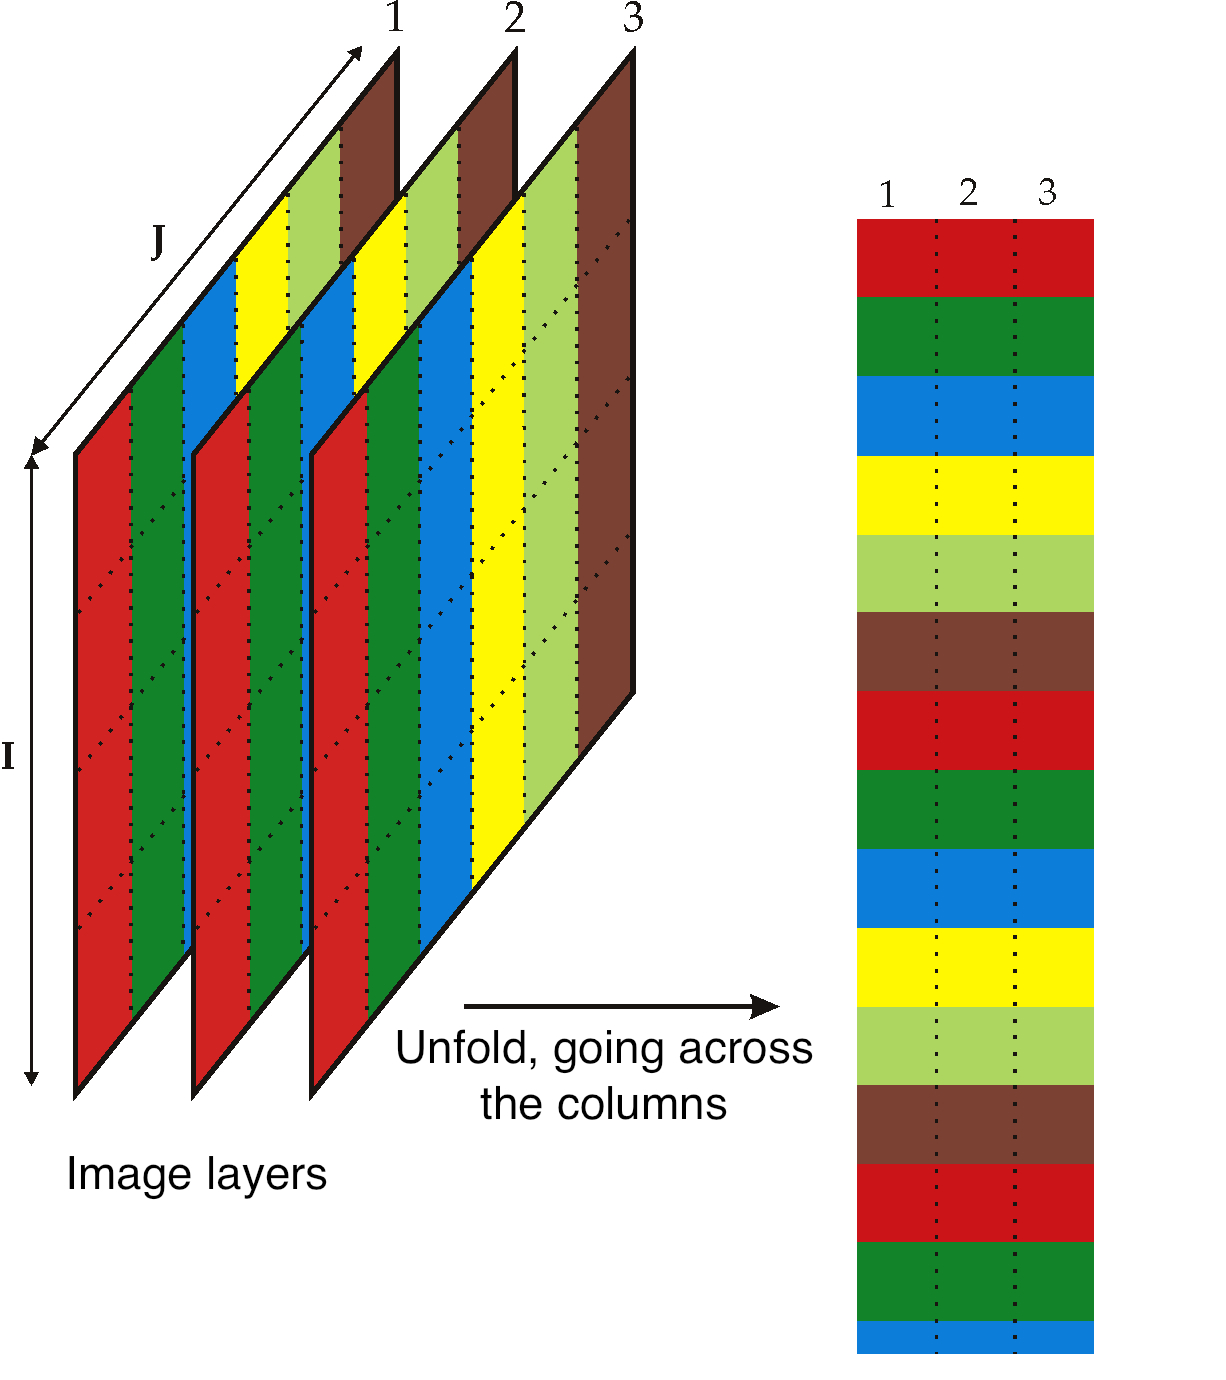
In the unfolded matrix we have \(IJ\) rows and 3 columns. In other words, each pixel in the image is represented in its own row. A digital image with 768 rows and 1024 columns, would therefore be unfolded into a matrix with 786,432 rows and 3 columns. If we perform PCA on this matrix we can calculate score values and SPE values: one per pixel. Those scores can be refolded back into the original shape of the image. It is useful to visualize those scores and SPE values in this way.
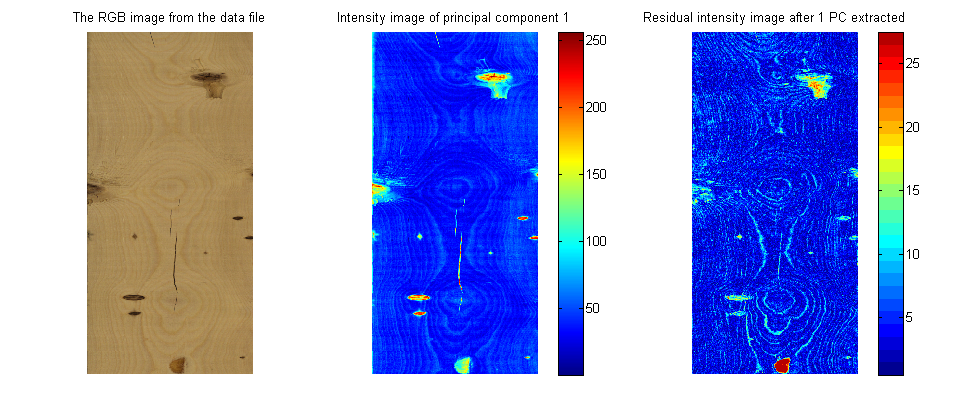
You can learn more about using PCA on image data in the manual that accompanies the interactive software that is freely available from https://macc.mcmaster.ca/maccmia.php.
7.6.1. References to incorporate
7.6.1.1. Foundational MIA papers and books
Paul Geladi, Svante Wold and Kim H. Esbensen, “Image analysis and chemical information in images”, Analytica Chimica Acta, 191, 473-480, 1986.
Paul Geladi, Hans Isaksson, Lennart Lindqvist, Svante Wold and Kim H. Esbensen, “Principal component analysis of multivariate images”, Chemometrics and Intelligent Laboratory Systems, 5, 209-220, 1989.
Kim H. Esbensen and Paul Geladi, “Strategy of multivariate image analysis (MIA)”, Chemometrics and Intelligent Laboratory Systems, 7, 67-86, 1989.
Paul Geladi, Ewert Bengtsson, Kim H. Esbensen and Hans Grahn, “Image analysis in chemistry I: Properties of images, greylevel operations, the multivariate image”, TrAC Trends in Analytical Chemistry, 11, 41-53, 1992.
Paul Geladi, Hans Grahn, Kim H. Esbensen and Ewert Bengtsson, “Image analysis in chemistry II: Multivariate image analysis”, TrAC Trends in Analytical Chemistry, 11, 121-130, 1992.
Paul Geladi and Hans Grahn, Multivariate Image Analysis, Wiley, 1997.
Hans Grahn and Paul Geladi, Techniques and Applications of Hyperspectral Image Analysis, Wiley, 2007.
José M. Prats-Montalbán, Anna De Juan and Alberto J. Ferrer, “Multivariate image analysis: A review with applications”, Chemometrics and Intelligent Laboratory Systems, 107, 1-23, 2011.
James Burger and Aoife A. Gowen, “Data handling in hyperspectral image analysis”, Chemometrics and Intelligent Laboratory Systems, 108, 13-22, 2011.
Aoife A. Gowen, Federico Marini, Carlos Esquerre, C. P. F. O’Donnell, G. Downey and James Burger, “Time series hyperspectral chemical imaging data: Challenges, solutions and applications”, Analytica Chimica Acta, 705, 272-282, 2011.
7.6.1.2. Industrial applications and case studies
Manish H. Bharati and John F. MacGregor, “Multivariate image analysis for real-time process monitoring and control”, Industrial and Engineering Chemistry Research, 37, 4715-4724, 1998.
Manish H. Bharati, John F. MacGregor and William Tropper, “Softwood lumber grading through on-line multivariate image analysis techniques”, Industrial and Engineering Chemistry Research, 42, 5345-5353, 2003.
Honglu Yu and John F. MacGregor, “Multivariate image analysis and regression for prediction of coating content and distribution in the production of snack foods”, Chemometrics and Intelligent Laboratory Systems, 67, 125-144, 2003.
Honglu Yu, John F. MacGregor, Gabe Haarsma and Wilfred Bourg, “Digital imaging for online monitoring and control of industrial snack food processes”, Industrial and Engineering Chemistry Research, 42, 3036-3044, 2003.
Honglu Yu and John F. MacGregor, “Monitoring flames in an industrial boiler using multivariate image analysis”, AIChE Journal, 50, 1474-1483, 2004.
Manish H. Bharati, Jay Liu and John F. MacGregor, “Image texture analysis: Methods and comparisons”, Chemometrics and Intelligent Laboratory Systems, 72, 57-71, 2004.
Jay Liu, Manish H. Bharati, Kevin G. Dunn and John F. MacGregor, “Automatic masking in multivariate image analysis using support vector machines”, Chemometrics and Intelligent Laboratory Systems, 79, 42-54, 2005.
Gabor Szatvanyi, Carl Duchesne and G. Bartolacci, “Multivariate image analysis of flames for product quality and combustion control in rotary kilns”, Industrial and Engineering Chemistry Research, 45, 4706-4715, 2005.
Jay Liu and John F. MacGregor, “On the extraction of spectral and spatial information from images”, Chemometrics and Intelligent Laboratory Systems, 85, 119-130, 2007.
7.6.1.3. Theses (McMaster University)
Manish H. Bharati, Multivariate image analysis for real-time process monitoring, Masters thesis, 1997.
Manish H. Bharati, Multivariate image analysis and regression for industrial process monitoring and product quality control, Ph.D thesis, 2002.
Jay Liu, Machine vision for process industries: Monitoring, control, and optimization of visual quality of processes and products, Ph.D thesis, 2004.
Zheng Liu, NIR imaging and its application to wheat grading, Masters thesis, 2006.
Mark-John Bruwer, Process systems approaches to diagnostic imaging and property prediction, Ph.D thesis, 2006.