 Download PDF of entire book
6.5.12. Hotelling’s T²
The final quantity from a PCA model that we need to consider is called Hotelling’s \(T^2\) value. Some PCA models will have many components, \(A\), so an initial screening of these components using score scatterplots will require reviewing \(A(A-1)/2\) scatterplots. The \(T^2\) value for the \(i^\text{th}\) observation is defined as:
where the \(s_a^2\) values are constants, and are the variances of each component. The easiest interpretation is that \(T^2\) is a scalar number that summarizes all the score values. Some other properties regarding \(T^2\):
It is a positive number, greater than or equal to zero.
It is the distance from the center of the (hyper)plane to the projection of the observation onto the (hyper)plane.
An observation that projects onto the model’s center (usually the observation where every value is at the mean), has \(T^2 = 0\).
The limit for \(T^2\) comes from the \(F\)-distribution. Below the 95% limit we expect, under normal conditions, to find 95% of the observations. For a model built from \(N\) observations with \(A\) components, the 95% limit for a new observation, one not used to build the model, is approximately
\[T^2_{A, 0.95} = \dfrac{A(N-1)(N+1)}{N(N-A)} \, F_{0.95}(A, N-A)\]where \(F_{0.95}(A, N-A)\) is the 95th percentile of the \(F\)-distribution with \(A\) and \(N-A\) degrees of freedom. The approximation treats the \(A\) scores as multivariate normal, with variances estimated from the \(N\) observations, and ignores that the loadings are estimated from those same observations. This is the limit the
hotellings_t2_limitmethod of a fittedprocess_improvemodel returns. The observations used to build the model are often plotted against the slightly smaller \(A(N-1)/(N-A) \, F_{0.95}(A, N-A)\) instead, as in the figure below. Strictly, those observations follow a scaled beta distribution, whose limit is lower still. The first two limits differ only by the factor \((N+1)/N\). The beta limit lies further below, by more when \(A\) is large relative to \(N\). Tracy, Young and Mason give the new-observation limit and the beta distribution in “Multivariate control charts for individual observations”, Journal of Quality Technology, 24 (2), 88-95, 1992.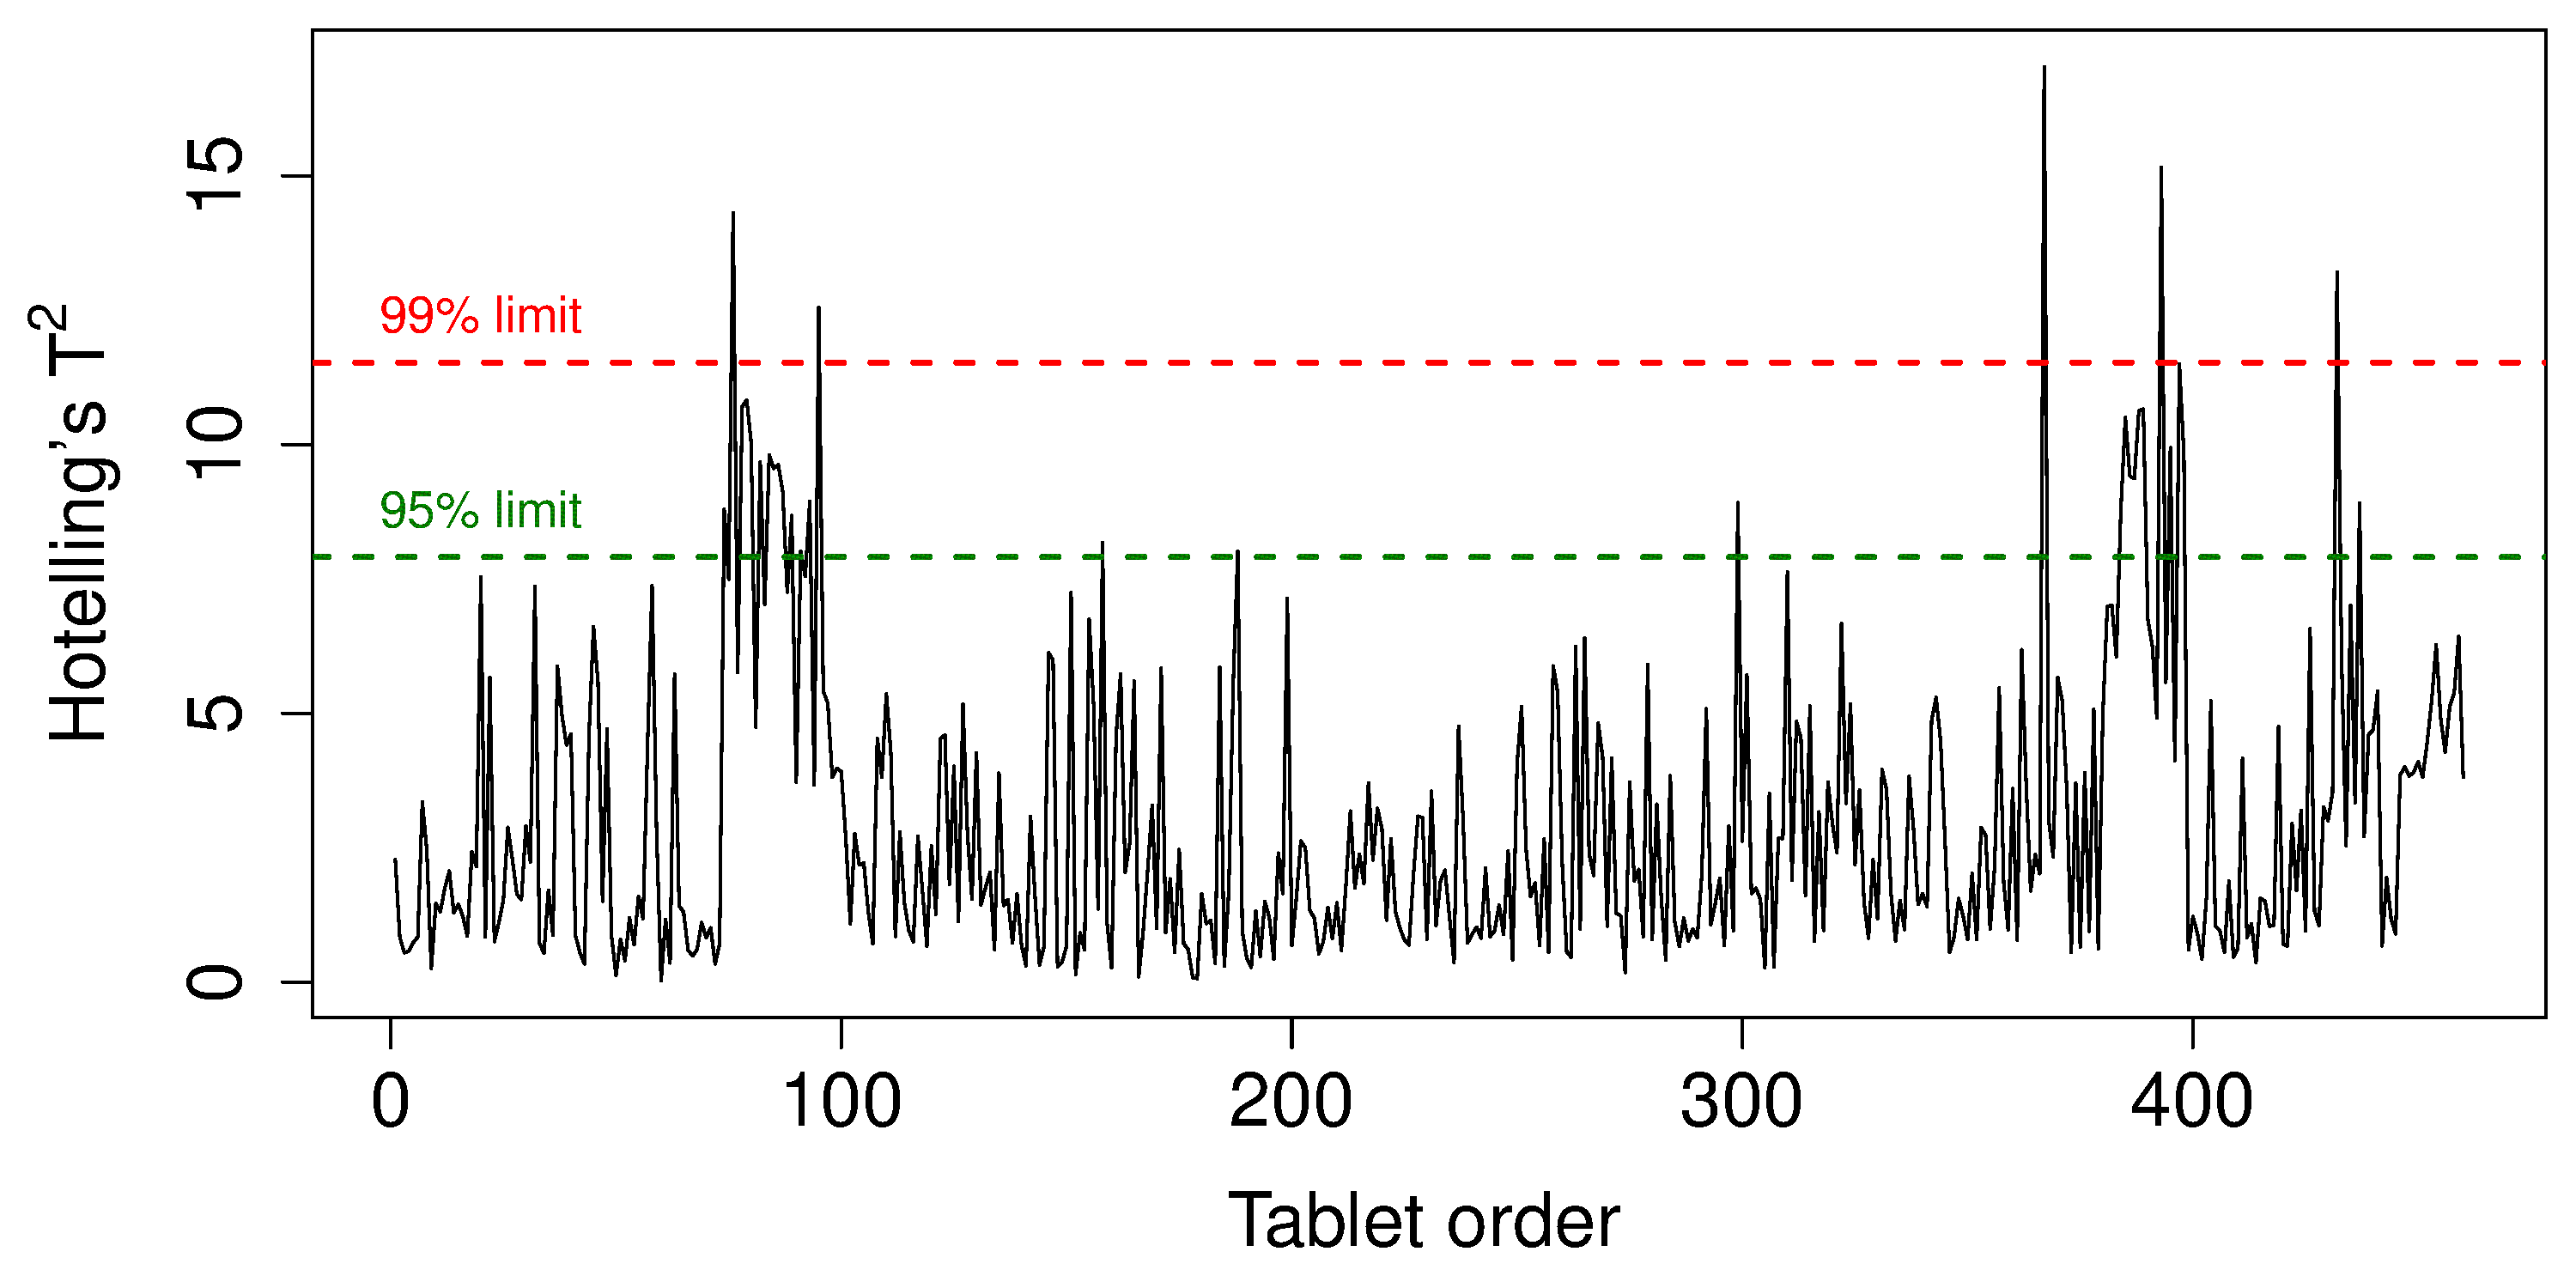
It is useful to consider the case when \(A=2\), and fix the \(T^2\) value at its 95% limit, for example, call that \(T^2_{A=2, \alpha=0.95}\). Using the definition for \(T^2\):
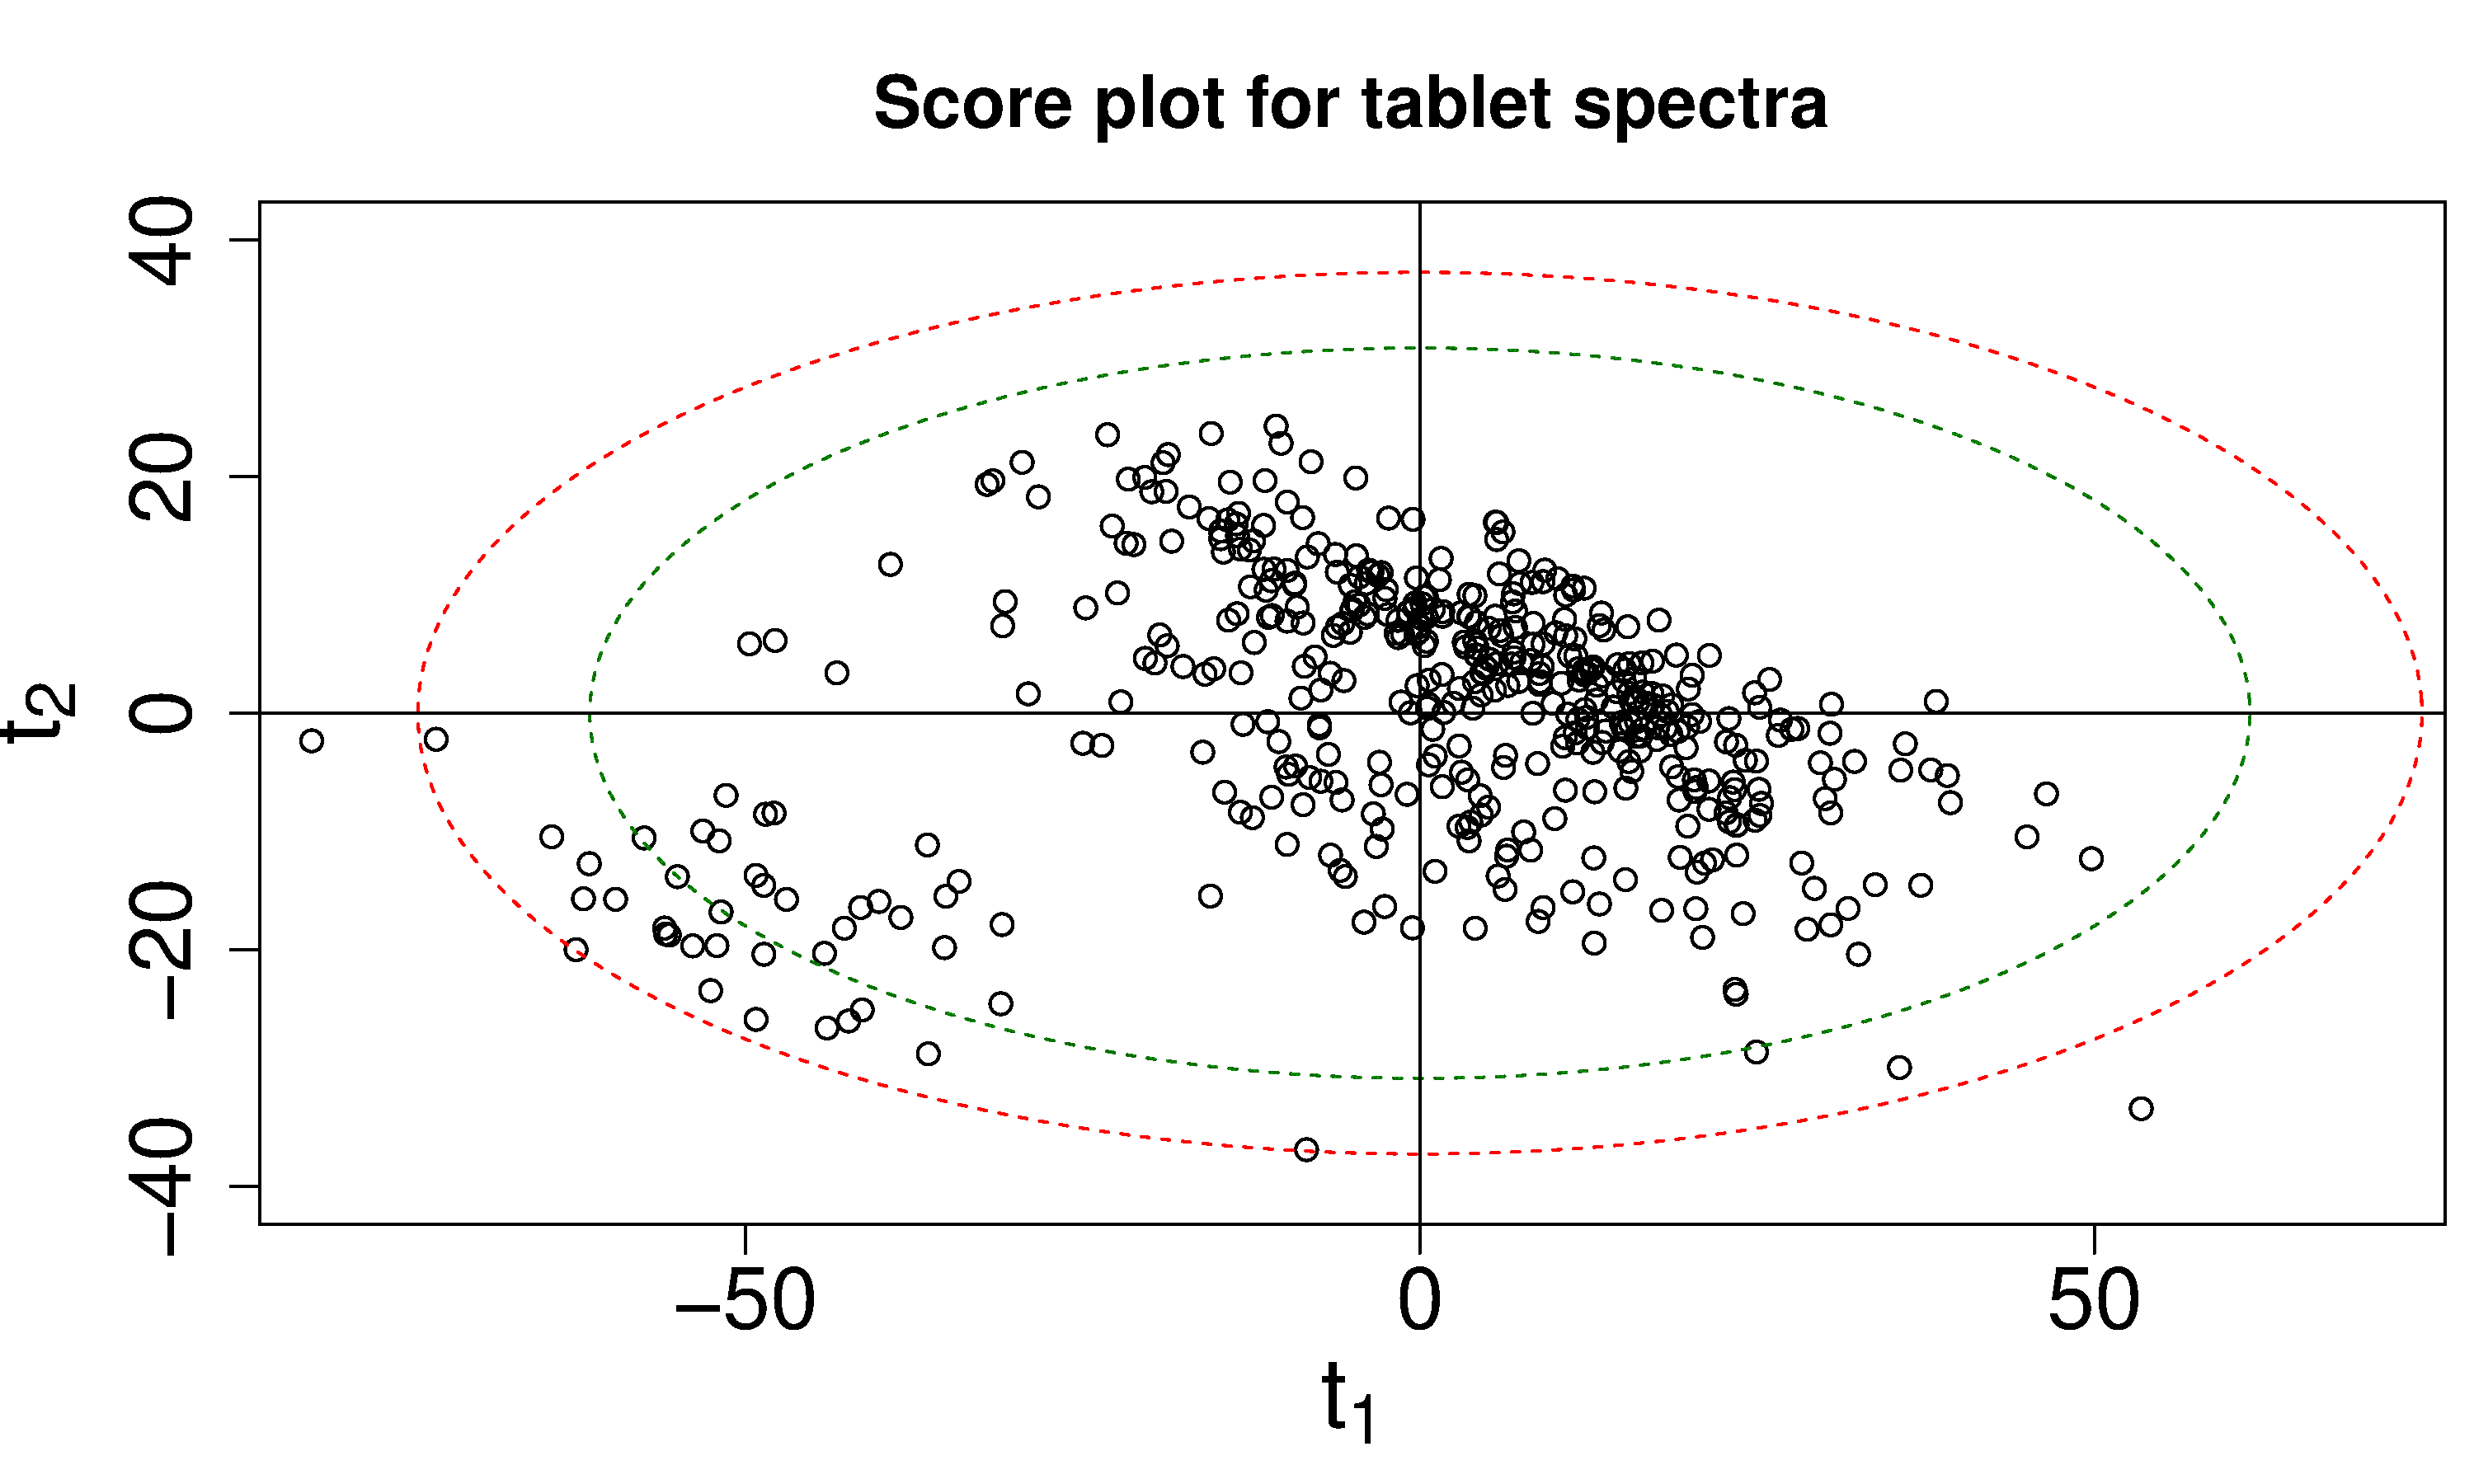
\[T^2_{A=2, \alpha=0.95} = \dfrac{t^2_{1}}{s^2_1} + \dfrac{t^2_{2}}{s^2_2}\]On a scatterplot of \(t_1\) vs \(t_2\) for all observations, this would be the equation of an ellipse, centered at the origin. You will often see this ellipse shown on \(t_i\) vs \(t_j\) scatterplots of the scores. Points inside this elliptical region are within the 95% confidence limit for \(T^2\).
The same principle holds for \(A>2\), except the ellipse is called a hyper-ellipse (think of a rugby-ball shaped object for \(A=3\)). The general interpretation is that if a point is within this ellipse, then it is also below the \(T^2\) limit, if \(T^2\) were to be plotted on a line.